PROTECTED SOURCE SCRIPT
Square Lines Around customized font_RAMLAKSHMANDAS
Square Lines Around customized font_RAMLAKSHMANDAS
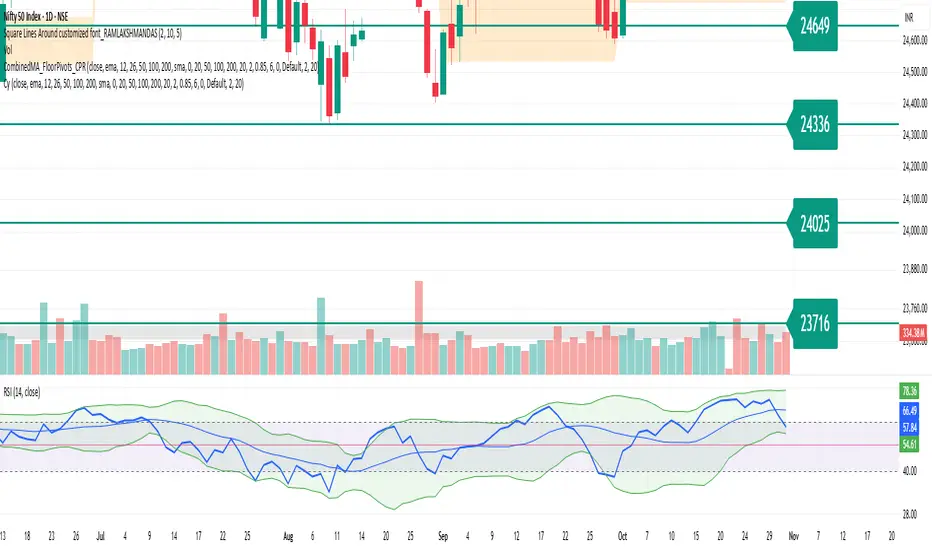
This indicator draws dynamic horizontal lines at all integer squares around the square root of the current close price, helping traders visualize price levels with mathematical significance. Each line is labeled, and the level font size can be customized interactively through a simple “Text Size (1-5)” input, making it easy to adapt for different chart sizes or visibility needs.
Features:
Plots horizontal lines at every perfect square (i.e.,
i
2
i
2
) near the rounded square root of close price.
Displays level values as labels, with user-adjustable font size (select 1 to 5, mapped to tiny up to huge).
All lines and labels (levels) are automatically updated with each new candle.
User controls for line color, line width, level range, and label font size.
Fully compatible with all TradingView intervals and symbols.
Usage:
Helps spot mathematically relevant support/resistance zones for custom strategies.
Useful for visual traders, quant experimenters, and anyone interested in market geometry.
Best suited for intraday, positional or backtest analysis where precise price levels matter.
Customizations:
Range +/- around square root (choose how many lines you want).
Line color and thickness for clarity.
Select label font size: 1 (tiny), 2 (small), 3 (normal), 4 (large), 5 (huge).
How to use:
Add to your chart, tweak settings in the input panel, and see instant updates.
Labels are sized to your preference for maximum visibility.
보호된 스크립트입니다
이 스크립트는 비공개 소스로 게시됩니다. 하지만 이를 자유롭게 제한 없이 사용할 수 있습니다 – 자세한 내용은 여기에서 확인하세요.
면책사항
해당 정보와 게시물은 금융, 투자, 트레이딩 또는 기타 유형의 조언이나 권장 사항으로 간주되지 않으며, 트레이딩뷰에서 제공하거나 보증하는 것이 아닙니다. 자세한 내용은 이용 약관을 참조하세요.
보호된 스크립트입니다
이 스크립트는 비공개 소스로 게시됩니다. 하지만 이를 자유롭게 제한 없이 사용할 수 있습니다 – 자세한 내용은 여기에서 확인하세요.
면책사항
해당 정보와 게시물은 금융, 투자, 트레이딩 또는 기타 유형의 조언이나 권장 사항으로 간주되지 않으며, 트레이딩뷰에서 제공하거나 보증하는 것이 아닙니다. 자세한 내용은 이용 약관을 참조하세요.