OPEN-SOURCE SCRIPT
Analyse-Werte im Chart (Multi-Timeframe)
Core Components
The indicator evaluates a trend based on four main pillars, which are combined into an overall score:
Momentum (Rate of Change / Standard Deviation): Measures the strength and speed of the current price movement. High momentum indicates a strong, directional move.
Trend Stability (R² - R-Squared): This is the heart of the analysis. The indicator searches for the best-fitting linear regression line within a user-defined period. The R² value (0-100%) indicates how well the price action fits this straight line. A high value signals a very stable, "clean" trend.
Stability/Risk (Rate of Change / Ulcer Index): Compares the trend strength to the pullbacks (drawdowns) it has experienced. A trend that rises steadily without suffering deep declines receives a high rating here.
RSI Proximity to 60: A small bonus factor based on the assumption that strong uptrends often use the 60 RSI level as support.
## The Output Table
The result of this analysis is displayed in a clear table:
Score Value: An overall grade from 0 to 100 that provides a weighted summary of the four components mentioned above.
R2 Value (%): Indicates the percentage of "linearity" of the identified trend.
Regression Length: The number of candles over which the most stable trend was found.
Channel Z-Value: Measures how many standard deviations the current price is away from the trend line. A high positive value (> 1.8) can indicate an over-extended or "overheated" condition.
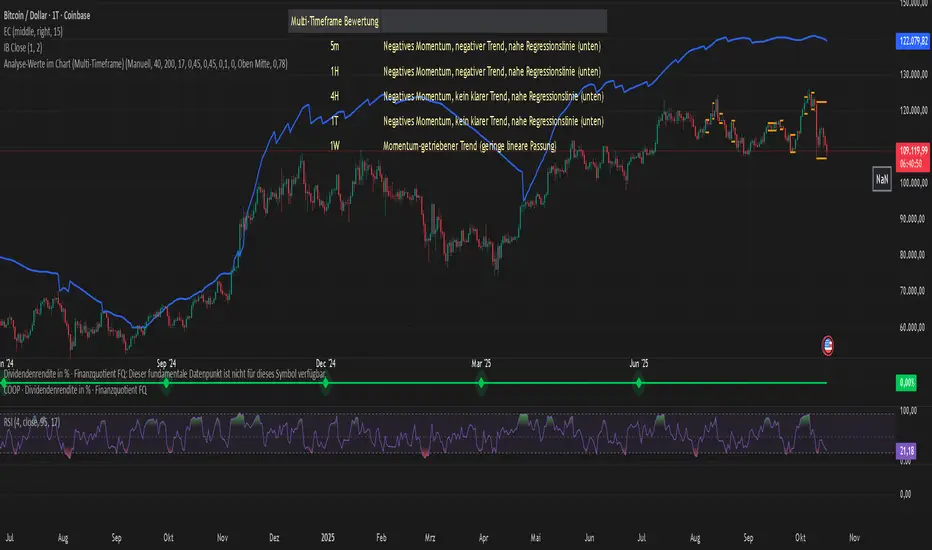
Evaluation: An auto-generated text that translates the mathematical values into a human-readable assessment. It distinguishes between stable trends, momentum-driven (unstable) trends, corrections, and sideways phases.
Multi-Timeframe Analysis: Shows the "Evaluation" for various timeframes (from 5 minutes to 1 week), allowing for a quick overview of the asset's overall picture.
## Flexibility through Profiles and Manual Control
One of the indicator's greatest strengths is its customizability:
Profiles: You can switch between three predefined analysis profiles with a single click:
Short-Term: Focuses on high momentum for day trading.
Mid-Term: A balanced setting for swing trading (Standard).
Long-Term: Focuses on the stability of the primary trend for investors.
Manual Mode: Allows you to adjust every single setting (R2 lengths, score weights) yourself to perfectly tailor the indicator to your own strategy and the specific chart.
The indicator evaluates a trend based on four main pillars, which are combined into an overall score:
Momentum (Rate of Change / Standard Deviation): Measures the strength and speed of the current price movement. High momentum indicates a strong, directional move.
Trend Stability (R² - R-Squared): This is the heart of the analysis. The indicator searches for the best-fitting linear regression line within a user-defined period. The R² value (0-100%) indicates how well the price action fits this straight line. A high value signals a very stable, "clean" trend.
Stability/Risk (Rate of Change / Ulcer Index): Compares the trend strength to the pullbacks (drawdowns) it has experienced. A trend that rises steadily without suffering deep declines receives a high rating here.
RSI Proximity to 60: A small bonus factor based on the assumption that strong uptrends often use the 60 RSI level as support.
## The Output Table
The result of this analysis is displayed in a clear table:
Score Value: An overall grade from 0 to 100 that provides a weighted summary of the four components mentioned above.
R2 Value (%): Indicates the percentage of "linearity" of the identified trend.
Regression Length: The number of candles over which the most stable trend was found.
Channel Z-Value: Measures how many standard deviations the current price is away from the trend line. A high positive value (> 1.8) can indicate an over-extended or "overheated" condition.
Evaluation: An auto-generated text that translates the mathematical values into a human-readable assessment. It distinguishes between stable trends, momentum-driven (unstable) trends, corrections, and sideways phases.
Multi-Timeframe Analysis: Shows the "Evaluation" for various timeframes (from 5 minutes to 1 week), allowing for a quick overview of the asset's overall picture.
## Flexibility through Profiles and Manual Control
One of the indicator's greatest strengths is its customizability:
Profiles: You can switch between three predefined analysis profiles with a single click:
Short-Term: Focuses on high momentum for day trading.
Mid-Term: A balanced setting for swing trading (Standard).
Long-Term: Focuses on the stability of the primary trend for investors.
Manual Mode: Allows you to adjust every single setting (R2 lengths, score weights) yourself to perfectly tailor the indicator to your own strategy and the specific chart.
오픈 소스 스크립트
트레이딩뷰의 진정한 정신에 따라, 이 스크립트의 작성자는 이를 오픈소스로 공개하여 트레이더들이 기능을 검토하고 검증할 수 있도록 했습니다. 작성자에게 찬사를 보냅니다! 이 코드는 무료로 사용할 수 있지만, 코드를 재게시하는 경우 하우스 룰이 적용된다는 점을 기억하세요.
면책사항
해당 정보와 게시물은 금융, 투자, 트레이딩 또는 기타 유형의 조언이나 권장 사항으로 간주되지 않으며, 트레이딩뷰에서 제공하거나 보증하는 것이 아닙니다. 자세한 내용은 이용 약관을 참조하세요.
오픈 소스 스크립트
트레이딩뷰의 진정한 정신에 따라, 이 스크립트의 작성자는 이를 오픈소스로 공개하여 트레이더들이 기능을 검토하고 검증할 수 있도록 했습니다. 작성자에게 찬사를 보냅니다! 이 코드는 무료로 사용할 수 있지만, 코드를 재게시하는 경우 하우스 룰이 적용된다는 점을 기억하세요.
면책사항
해당 정보와 게시물은 금융, 투자, 트레이딩 또는 기타 유형의 조언이나 권장 사항으로 간주되지 않으며, 트레이딩뷰에서 제공하거나 보증하는 것이 아닙니다. 자세한 내용은 이용 약관을 참조하세요.