PROTECTED SOURCE SCRIPT
Key Levels: Daily, Overnight, Weekly + Labels
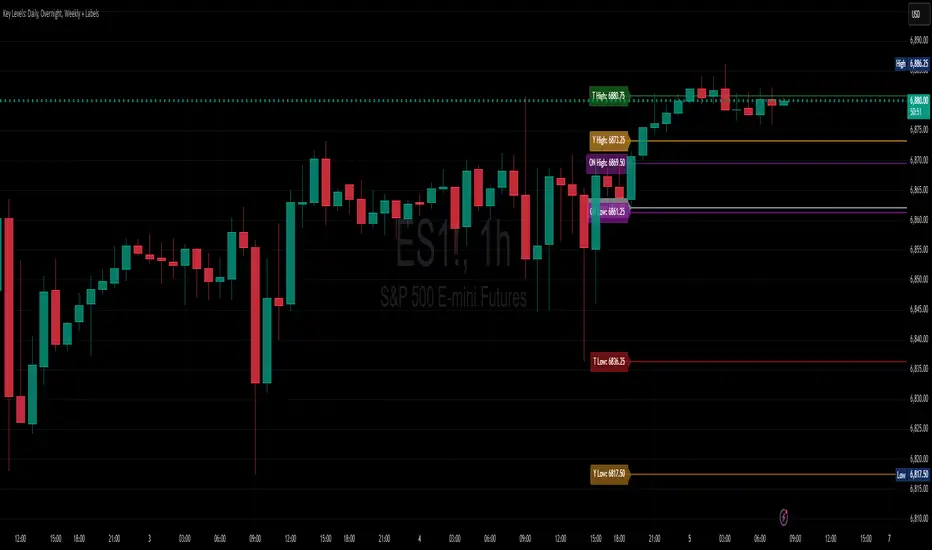
This indicator automatically plots the most critical market levels that institutions and active traders monitor daily. It is designed for intraday precision, scalping, day trading, and context framing across all asset classes.
What It Plots
The script dynamically draws and labels:
1️⃣ Daily Levels
Today’s High / Low
Yesterday’s High / Low / Close
These levels help define intraday bias, breakout zones, and trend continuation or rejection areas.
2️⃣ Overnight Session Levels
Automatically detects the Globex / Overnight session (4:00 PM–4:00 AM) and tracks:
Overnight High
Overnight Low
Useful for identifying liquidity zones, gap direction, and early-session ORB behavior.
3️⃣ Weekly Levels
Previous Week’s High / Low
Ideal for swing context, weekly ranges, institutional targeting levels, and mean reversion setups.
🧠 Smart Automation
The indicator resets and redraws levels when:
A new trading day begins
A new weekly session starts
All lines include auto-extending levels and clean right-hand labels with color coding for instant visibility.
🎨 Clean and Lightweight Visuals
Uses dynamic arrays to track and clear historical drawings.
Labels are small, unobtrusive, and positioned to the right for easy reference.
Colors follow directional bias conventions
Green = Today High
Red = Today Low
Orange = Yesterday Levels
Purple = Overnight
Blue = Weekly
🧩 Perfect For
Scalpers
Intraday bias mapping
Liquidity/stop-run detection
ORB, VWAP, and trend-reversal setups
Weekly swing bias anchoring
보호된 스크립트입니다
이 스크립트는 비공개 소스로 게시됩니다. 하지만 이를 자유롭게 제한 없이 사용할 수 있습니다 – 자세한 내용은 여기에서 확인하세요.
면책사항
해당 정보와 게시물은 금융, 투자, 트레이딩 또는 기타 유형의 조언이나 권장 사항으로 간주되지 않으며, 트레이딩뷰에서 제공하거나 보증하는 것이 아닙니다. 자세한 내용은 이용 약관을 참조하세요.
보호된 스크립트입니다
이 스크립트는 비공개 소스로 게시됩니다. 하지만 이를 자유롭게 제한 없이 사용할 수 있습니다 – 자세한 내용은 여기에서 확인하세요.
면책사항
해당 정보와 게시물은 금융, 투자, 트레이딩 또는 기타 유형의 조언이나 권장 사항으로 간주되지 않으며, 트레이딩뷰에서 제공하거나 보증하는 것이 아닙니다. 자세한 내용은 이용 약관을 참조하세요.