INVITE-ONLY SCRIPT
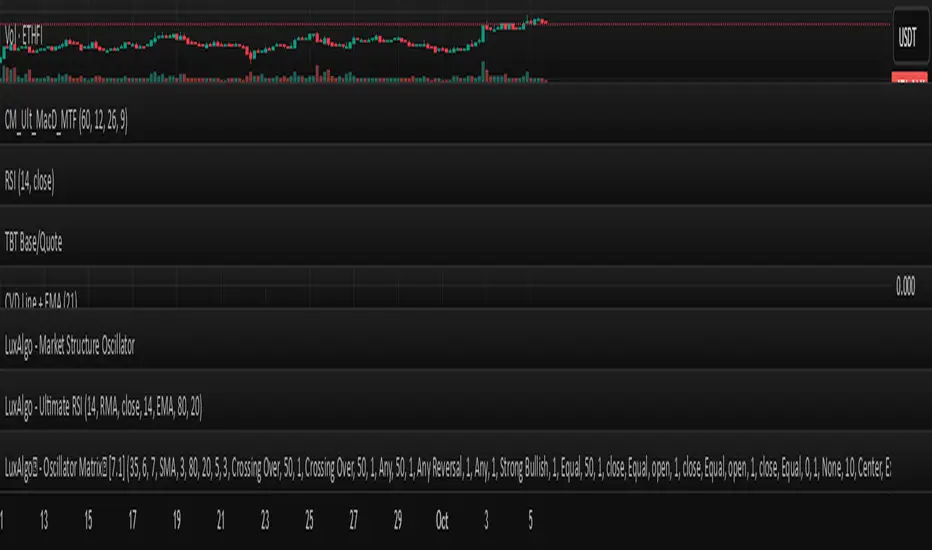
CVD Line + EMA

This indicator visualizes the Cumulative Volume Delta (CVD) as a line and overlays an Exponential Moving Average (EMA, default length 21) on the CVD. The CVD estimates buy/sell volume using candle direction, accumulating volume when price moves up or down. The EMA helps smooth the CVD, quickly signaling directional shifts that can indicate potential trend changes. The line turns green when CVD holds above its EMA (suggesting bullish pressure) and red when below (suggesting bearish pressure).
Settings allow users to customize the EMA period to suit different timeframes or trading strategies. The script is intended for educational purposes and is released under the Mozilla Public License 2.0. For best results, use in conjunction with other analysis and risk management tools.
Settings allow users to customize the EMA period to suit different timeframes or trading strategies. The script is intended for educational purposes and is released under the Mozilla Public License 2.0. For best results, use in conjunction with other analysis and risk management tools.
초대 전용 스크립트
이 스크립트는 작성자가 승인한 사용자만 접근할 수 있습니다. 사용하려면 요청을 보내고 승인을 받아야 합니다. 일반적으로 결제 후에 승인이 이루어집니다. 자세한 내용은 아래 작성자의 지침을 따르거나 MFH_BM에게 직접 문의하세요.
트레이딩뷰는 스크립트 작성자를 완전히 신뢰하고 스크립트 작동 방식을 이해하지 않는 한 스크립트 비용을 지불하거나 사용하지 않는 것을 권장하지 않습니다. 무료 오픈소스 대체 스크립트는 커뮤니티 스크립트에서 찾을 수 있습니다.
작성자 지시 사항
This indicator plots the Cumulative Volume Delta (CVD) and overlays an adjustable Exponential Moving Average (EMA, default length 21) on it.
Adjust the EMA length in the settings as needed for your timeframe or asset.
면책사항
이 정보와 게시물은 TradingView에서 제공하거나 보증하는 금융, 투자, 거래 또는 기타 유형의 조언이나 권고 사항을 의미하거나 구성하지 않습니다. 자세한 내용은 이용 약관을 참고하세요.