OPEN-SOURCE SCRIPT
Reversal Candle Anomaly Detector w/Volume-Colored Candles (VPA)
Automate your pinescript/trendspider to Tradovate/Ninja-Trader! ninja-view.com
Reversal Candle Anomaly Detector with Volume-Colored Candles (VPA Analysis)
This script is rooted in the principles of Volume Price Analysis (VPA), as illustrated by Anna Couling in "A Complete Guide To Volume Price Analysis" and Thor Young in "A Complete Day Trading System". It aims to spotlight candlestick formations and volume irregularities, which frequently signal potential market reversals or the directional intent of market makers.
Features:
Volume-Based Candle Coloring:
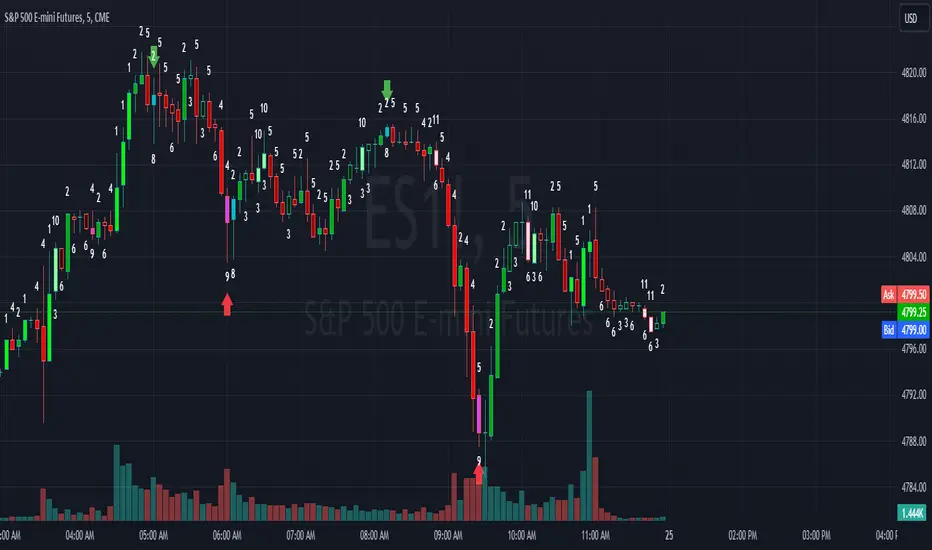
High Volume Candles: Bright green (for up candles) and bright red (for down candles), marking robust market participation.
Low Volume Candles: Darker shades of green and red, indicative of subdued trading activity.
Average Volume Candles: Standard green and red colors.
Anomaly Detection:
Short Anomalies: Short candles or candle bodies with unusually high volume, displayed in cyan (up candles) and magenta (down candles), hinting at potential market anomalies.
Tall Anomalies: Tall candles or candle bodies with low volume, shown in very light green and red colors, nearly white, suggesting another type of market anomaly.
Customization Options:
RSI Filter: An RSI (Relative Strength Index) option is available to minimize noise in short anomaly candles.
Adjustable Anomaly Criteria: Users can define what constitutes 'tall' or 'short' candles based on a percentage comparison to an average candle size.
Average Calculation: The script calculates the average size and volume of candles over a user-defined period for baseline anomaly detection.
Toggle for Anomaly Numbering: An option to enable or disable numbering of candle anomalies, which aids in filtering for algorithmic trading strategies.
Trading Insights and Tips:
Magenta/Cyan Anomaly Candles: Approach these 'magic candles' with caution, particularly when a price reversal follows in the next candle. They often exhibit a retest pattern across multiple timeframes.
Support and Resistance: Isolated anomalies often correlate with key support or resistance levels, whether daily, intraday, or historical. Recognizing these levels is essential for market prediction.
Interpreting 'Magic Candles': These candles may reflect large traders taking profits, causing price stagnation and potential reversals due to the triggered chain reaction among traders.
Market Makers' Tactics: Tall, low-volume candles could signify market makers' efforts to rapidly alter price directions, sometimes as deceptive strategies to initiate market orders.
Significant Market Reversals: Patterns such as UTDAD (Up Thrust After Distribution) or Wyckoff Spring, characterized by tall, similar-height, often wickless candles, can indicate major market reversals, especially when they occur after extended price moves or at critical levels.
This Pine Script tool is invaluable for traders leveraging VPA. It offers visual indicators and insights into market psychology and potential price movements. By analyzing volume and candlestick patterns, traders can better understand market dynamics and enhance their trading decisions.
Reversal Candle Anomaly Detector with Volume-Colored Candles (VPA Analysis)
This script is rooted in the principles of Volume Price Analysis (VPA), as illustrated by Anna Couling in "A Complete Guide To Volume Price Analysis" and Thor Young in "A Complete Day Trading System". It aims to spotlight candlestick formations and volume irregularities, which frequently signal potential market reversals or the directional intent of market makers.
Features:
Volume-Based Candle Coloring:
High Volume Candles: Bright green (for up candles) and bright red (for down candles), marking robust market participation.
Low Volume Candles: Darker shades of green and red, indicative of subdued trading activity.
Average Volume Candles: Standard green and red colors.
Anomaly Detection:
Short Anomalies: Short candles or candle bodies with unusually high volume, displayed in cyan (up candles) and magenta (down candles), hinting at potential market anomalies.
Tall Anomalies: Tall candles or candle bodies with low volume, shown in very light green and red colors, nearly white, suggesting another type of market anomaly.
Customization Options:
RSI Filter: An RSI (Relative Strength Index) option is available to minimize noise in short anomaly candles.
Adjustable Anomaly Criteria: Users can define what constitutes 'tall' or 'short' candles based on a percentage comparison to an average candle size.
Average Calculation: The script calculates the average size and volume of candles over a user-defined period for baseline anomaly detection.
Toggle for Anomaly Numbering: An option to enable or disable numbering of candle anomalies, which aids in filtering for algorithmic trading strategies.
Trading Insights and Tips:
Magenta/Cyan Anomaly Candles: Approach these 'magic candles' with caution, particularly when a price reversal follows in the next candle. They often exhibit a retest pattern across multiple timeframes.
Support and Resistance: Isolated anomalies often correlate with key support or resistance levels, whether daily, intraday, or historical. Recognizing these levels is essential for market prediction.
Interpreting 'Magic Candles': These candles may reflect large traders taking profits, causing price stagnation and potential reversals due to the triggered chain reaction among traders.
Market Makers' Tactics: Tall, low-volume candles could signify market makers' efforts to rapidly alter price directions, sometimes as deceptive strategies to initiate market orders.
Significant Market Reversals: Patterns such as UTDAD (Up Thrust After Distribution) or Wyckoff Spring, characterized by tall, similar-height, often wickless candles, can indicate major market reversals, especially when they occur after extended price moves or at critical levels.
This Pine Script tool is invaluable for traders leveraging VPA. It offers visual indicators and insights into market psychology and potential price movements. By analyzing volume and candlestick patterns, traders can better understand market dynamics and enhance their trading decisions.
오픈 소스 스크립트
트레이딩뷰의 진정한 정신에 따라, 이 스크립트의 작성자는 이를 오픈소스로 공개하여 트레이더들이 기능을 검토하고 검증할 수 있도록 했습니다. 작성자에게 찬사를 보냅니다! 이 코드는 무료로 사용할 수 있지만, 코드를 재게시하는 경우 하우스 룰이 적용된다는 점을 기억하세요.
면책사항
해당 정보와 게시물은 금융, 투자, 트레이딩 또는 기타 유형의 조언이나 권장 사항으로 간주되지 않으며, 트레이딩뷰에서 제공하거나 보증하는 것이 아닙니다. 자세한 내용은 이용 약관을 참조하세요.
오픈 소스 스크립트
트레이딩뷰의 진정한 정신에 따라, 이 스크립트의 작성자는 이를 오픈소스로 공개하여 트레이더들이 기능을 검토하고 검증할 수 있도록 했습니다. 작성자에게 찬사를 보냅니다! 이 코드는 무료로 사용할 수 있지만, 코드를 재게시하는 경우 하우스 룰이 적용된다는 점을 기억하세요.
면책사항
해당 정보와 게시물은 금융, 투자, 트레이딩 또는 기타 유형의 조언이나 권장 사항으로 간주되지 않으며, 트레이딩뷰에서 제공하거나 보증하는 것이 아닙니다. 자세한 내용은 이용 약관을 참조하세요.