OPEN-SOURCE SCRIPT
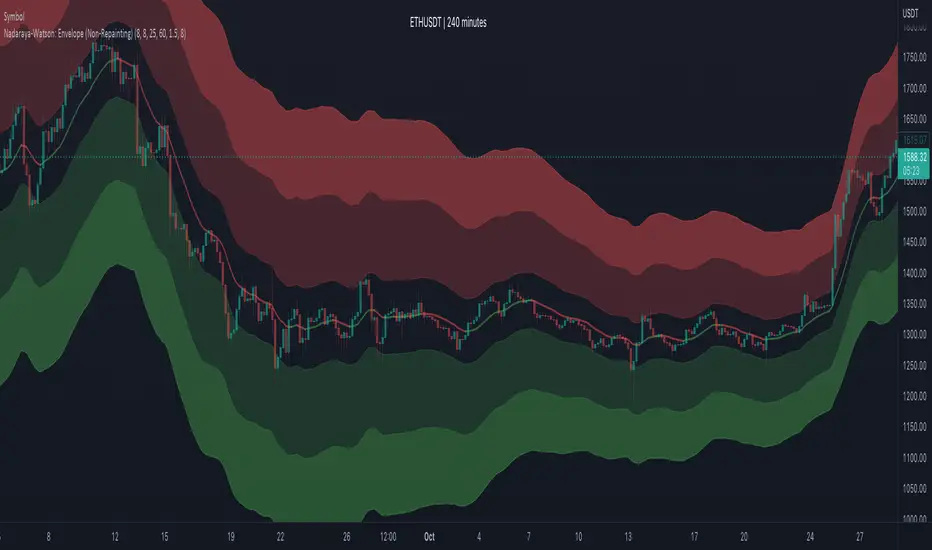
Nadaraya-Watson: Envelope (Non-Repainting)
Due to popular request, this is an envelope implementation of my non-repainting Nadaraya-Watson indicator using the Rational Quadratic Kernel. For more information on this implementation, please refer to the original indicator located here:
tradingview.com/v/AWNvbPRM/
What is an Envelope?
In technical analysis, an "envelope" typically refers to a pair of upper and lower bounds that surrounds price action to help characterize extreme overbought and oversold conditions. Envelopes are often derived from a simple moving average (SMA) and are placed at a predefined distance above and below the SMA from which they were generated. However, envelopes do not necessarily need to be derived from a moving average; they can be derived from any estimator, including a kernel estimator such as Nadaraya-Watson.
How to use this indicator?
Overall, this indicator offers a high degree of flexibility, and the location of the envelope's bands can be adjusted by (1) tweaking the parameters for the Rational Quadratic Kernel and (2) adjusting the lookback window for the custom ATR calculation. In a trending market, it is often helpful to use the Nadaraya-Watson estimate line as a floating SR and/or reversal zone. In a ranging market, it is often more convenient to use the two Upper Bands and two Lower Bands as reversal zones.
How are the Upper and Lower bounds calculated?
In this indicator, the Rational Quadratic (RQ) Kernel estimates the price value at each bar in a user-defined lookback window. From this estimation, the upper and lower bounds of the envelope are calculated based on a custom ATR calculated from the kernel estimations for the high, low, and close series, respectively. These calculations are then scaled against a user-defined multiplier, which can be used to further customize the Upper and Lower bounds for a given chart.
How to use Kernel Estimations like this for other indicators?
Kernel Functions are highly underrated, and when calibrated correctly, they have the potential to provide more value than any mundane moving average. For those interested in using non-repainting Kernel Estimations for technical analysis, I have written a Kernel Functions library that makes it easy to access various well-known kernel functions quickly. The Rational Quadratic Kernel is used in this implementation, but one can conveniently swap out other kernels from the library by modifying only a single line of code. For more details and usage examples, please refer to the Kernel Functions library located here:
오픈 소스 스크립트
진정한 TradingView 정신에 따라, 이 스크립트의 저자는 트레이더들이 이해하고 검증할 수 있도록 오픈 소스로 공개했습니다. 저자에게 박수를 보냅니다! 이 코드는 무료로 사용할 수 있지만, 출판물에서 이 코드를 재사용하는 것은 하우스 룰에 의해 관리됩니다. 님은 즐겨찾기로 이 스크립트를 차트에서 쓸 수 있습니다.
❤️ Patreon w/ Lorentzian 2.0: patreon.com/jdehorty
🎥 Lorentzian Classification Tutorial: youtu.be/AdINVvnJfX4
🤖 Discord: discord.gg/ai-edge-107567337
⏩ LinkedIn: linkedin.com/in/justin-dehorty
🎥 Lorentzian Classification Tutorial: youtu.be/AdINVvnJfX4
🤖 Discord: discord.gg/ai-edge-107567337
⏩ LinkedIn: linkedin.com/in/justin-dehorty
면책사항
이 정보와 게시물은 TradingView에서 제공하거나 보증하는 금융, 투자, 거래 또는 기타 유형의 조언이나 권고 사항을 의미하거나 구성하지 않습니다. 자세한 내용은 이용 약관을 참고하세요.