OPEN-SOURCE SCRIPT
업데이트됨 MTF Trend Truth [Hubka]
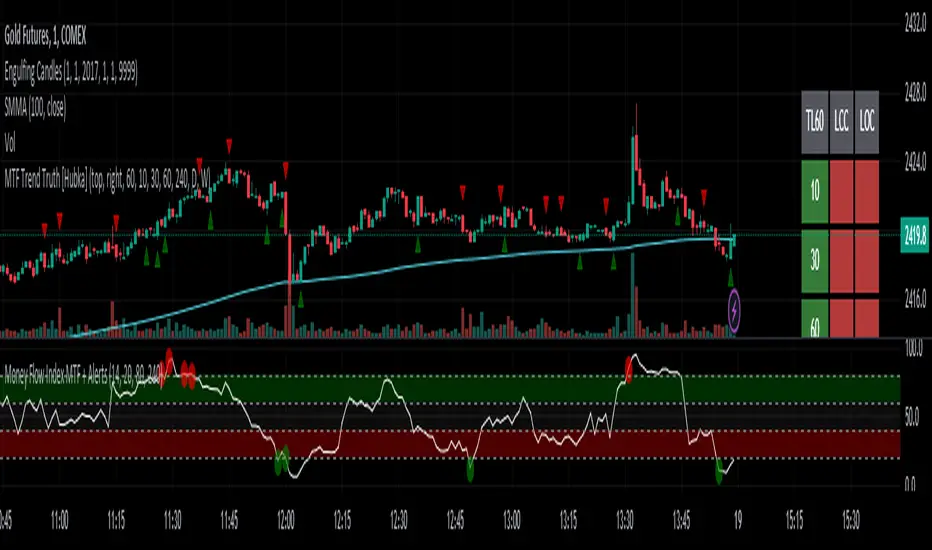
A Multi Time Frame Tend table that displays symbols trends for 6 selectable Time Intervals. In addition to the 6 first row color trends, the table also displays the direction of the last 2 candles in each Time Interval in the last 2 rows. This extra interval information displays price trend direction change or may add confluence if the price direction is the same.
The top row of the table has column header names described below:
(TL30) Column 1 - Trend Interval + The Trend Length selected (30 is default). Uses the last 30 candles to determine the trend for this interval. The length number is Editable.
(LCC) Column 2 - Last Closed Candle. This is the direction color of the second last candle on the chart.
(LOC) Column 3 - Last Open Candle. The is the current candle color direction of the last candle on the chart. This candle has not yet closed and will flicker as price changing state.
NOTE 1: (LOC) Column 3 - Last Open Candle - only displays correctly when the market is open and price is changing.
You can adjust the "Trend Length in Candles" which defaults to using the trend of the last 30 candles (TL30). Edit this setting to use any number from 5 to 99 candles back if you want display different trend lengths.
Having a visual table of the price trends from different time intervals can be beneficial to traders. For example... When observing that a symbol has many Bullish (green) price trends on several time intervals and the last 2 candles are also bullish it should afford a trader confluence to trade in that same bullish direction. However I am not a professional and do not offer any trading advice in any way. Use this indicator at your own risk.
NOTE 2: Time interval of 240 = 4 hours. Below 1 day number only is minutes.
릴리즈 노트
UPD: Change color transparency so table views better with white chart background.Change default trendLength default value from 30 to 60
오픈 소스 스크립트
트레이딩뷰의 진정한 정신에 따라, 이 스크립트의 작성자는 이를 오픈소스로 공개하여 트레이더들이 기능을 검토하고 검증할 수 있도록 했습니다. 작성자에게 찬사를 보냅니다! 이 코드는 무료로 사용할 수 있지만, 코드를 재게시하는 경우 하우스 룰이 적용된다는 점을 기억하세요.
면책사항
해당 정보와 게시물은 금융, 투자, 트레이딩 또는 기타 유형의 조언이나 권장 사항으로 간주되지 않으며, 트레이딩뷰에서 제공하거나 보증하는 것이 아닙니다. 자세한 내용은 이용 약관을 참조하세요.
오픈 소스 스크립트
트레이딩뷰의 진정한 정신에 따라, 이 스크립트의 작성자는 이를 오픈소스로 공개하여 트레이더들이 기능을 검토하고 검증할 수 있도록 했습니다. 작성자에게 찬사를 보냅니다! 이 코드는 무료로 사용할 수 있지만, 코드를 재게시하는 경우 하우스 룰이 적용된다는 점을 기억하세요.
면책사항
해당 정보와 게시물은 금융, 투자, 트레이딩 또는 기타 유형의 조언이나 권장 사항으로 간주되지 않으며, 트레이딩뷰에서 제공하거나 보증하는 것이 아닙니다. 자세한 내용은 이용 약관을 참조하세요.