OPEN-SOURCE SCRIPT
업데이트됨 Trend Sentiment [racer8]
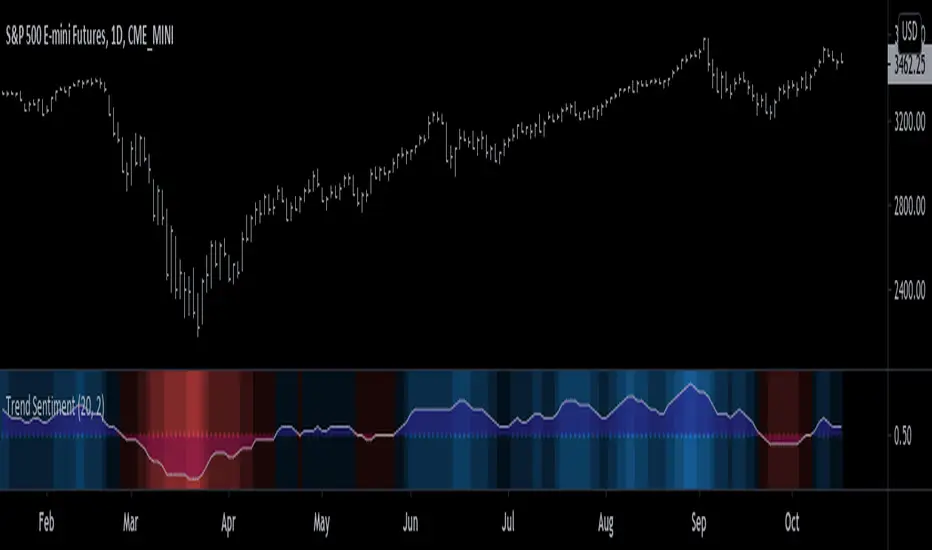
Trend Sentiment is a trend indicator with enhanced graphics, that is, it has many different shades of blue and red.
The brighter the blue, the more bullish.
The brighter the red, the more bearish.
It is a simple indicator with a basic formula:
a = close > prev.close? ---> If yes, a = 1, otherwise a = 0.
b = sma of a over n periods -----1st parameter, n...."Length"
c = sma of b over j periods ----- 2nd parmeter, j..."Smoothing"
plot (c)
Is c > 0.5? ---> If yes, background color = blue, otherwise red.
plot background color.
plot 0.5 as dotted midline.
The Trend Sentiment value represents the percentage of bullish force in the market.
Signals are generated when it crosses the 50% mark.
Values above 0.50 are bullish and values below 0.50 are bearish.
Enjoy and hit the like button :)
릴리즈 노트
Added area fill color.오픈 소스 스크립트
트레이딩뷰의 진정한 정신에 따라, 이 스크립트의 작성자는 이를 오픈소스로 공개하여 트레이더들이 기능을 검토하고 검증할 수 있도록 했습니다. 작성자에게 찬사를 보냅니다! 이 코드는 무료로 사용할 수 있지만, 코드를 재게시하는 경우 하우스 룰이 적용된다는 점을 기억하세요.
면책사항
해당 정보와 게시물은 금융, 투자, 트레이딩 또는 기타 유형의 조언이나 권장 사항으로 간주되지 않으며, 트레이딩뷰에서 제공하거나 보증하는 것이 아닙니다. 자세한 내용은 이용 약관을 참조하세요.
오픈 소스 스크립트
트레이딩뷰의 진정한 정신에 따라, 이 스크립트의 작성자는 이를 오픈소스로 공개하여 트레이더들이 기능을 검토하고 검증할 수 있도록 했습니다. 작성자에게 찬사를 보냅니다! 이 코드는 무료로 사용할 수 있지만, 코드를 재게시하는 경우 하우스 룰이 적용된다는 점을 기억하세요.
면책사항
해당 정보와 게시물은 금융, 투자, 트레이딩 또는 기타 유형의 조언이나 권장 사항으로 간주되지 않으며, 트레이딩뷰에서 제공하거나 보증하는 것이 아닙니다. 자세한 내용은 이용 약관을 참조하세요.