RicardoSantos

[RS]Price Linear Sequence Counter

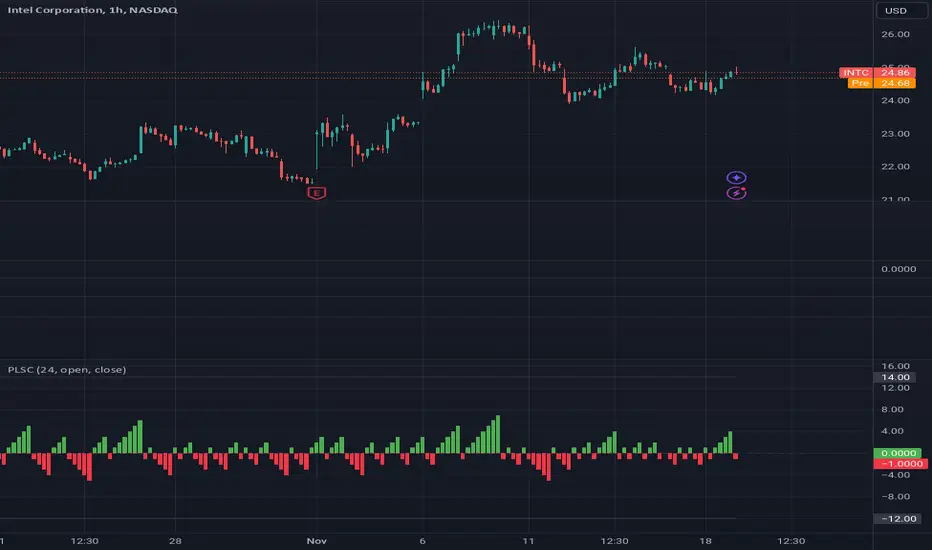
Simple green/red sequence counter, also gives current highest achieved sequence(black lines).
오픈 소스 스크립트

이 스크립트의 오써는 참된 트레이딩뷰의 스피릿으로 이 스크립트를 오픈소스로 퍼블리쉬하여 트레이더들로 하여금 이해 및 검증할 수 있도록 하였습니다. 오써를 응원합니다! 스크립트를 무료로 쓸 수 있지만, 다른 퍼블리케이션에서 이 코드를 재사용하는 것은 하우스룰을 따릅니다. 님은 즐겨찾기로 이 스크립트를 차트에서 쓸 수 있습니다.

면책사항

이 정보와 게시물은 TradingView에서 제공하거나 보증하는 금융, 투자, 거래 또는 기타 유형의 조언이나 권고 사항을 의미하거나 구성하지 않습니다. 자세한 내용은 이용 약관을 참고하세요.

차트에 이 스크립트를 사용하시겠습니까?
study(title="[RS]Price Linear Sequence Counter", shorttitle="[RS]PLSC.V0")
length = input(24)

sa = open

sb = close

//difrange = abs(sa-sb)
posdifrange = sb-sa >= 0 ? sb-sa : 0
negdifrange = sb-sa <= 0 ? sb-sa : 0

//dfappex = nz(dfappex[1]) <= difrange ? difrange : nz(dfappex[1])

poslinearsequence = posdifrange > 0 ? nz(poslinearsequence[1]) + 1 : 0
neglinearsequence = negdifrange < 0 ? nz(neglinearsequence[1]) - 1 : 0

plinappex = nz(plinappex[1]) <= poslinearsequence ? poslinearsequence : nz(plinappex[1])
nlinappex = nz(nlinappex[1]) >= neglinearsequence ? neglinearsequence : nz(nlinappex[1])

plot(poslinearsequence, color=green, style=columns)
plot(neglinearsequence, color=red, style=columns)
//plot(difrange)
//colorf(v, c) => v != 0 ? c : na
//plot(posdifrange, color=colorf(posdifrange, green), style=circles, linewidth=2)
//plot(negdifrange, color=colorf(negdifrange, red), style=circles, linewidth=2)

plot(plinappex, color=black)
plot(nlinappex, color=black)
hline(0, color=black)