OPEN-SOURCE SCRIPT
AntoQQE - Histogram
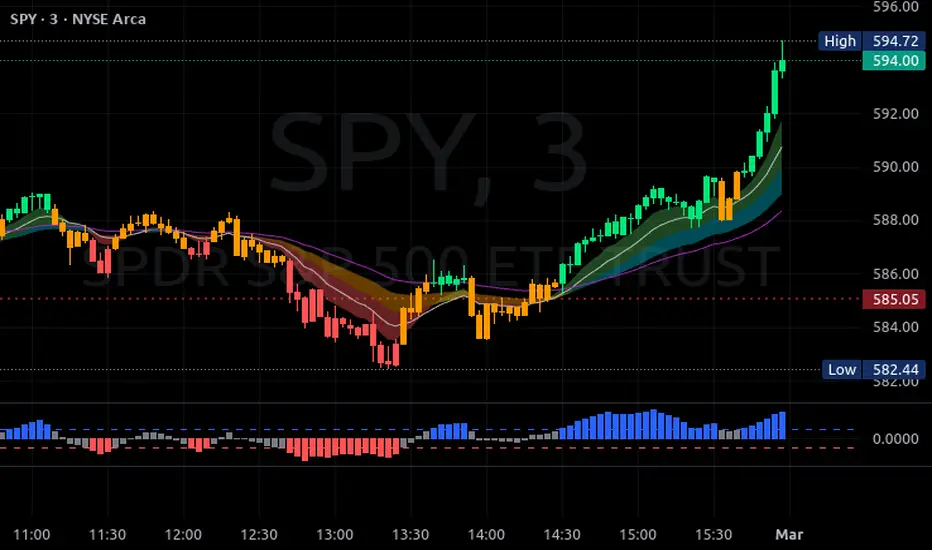
This script displays a QQE-based momentum histogram, derived from the RSI line’s deviation around a neutral 50 level. It uses a smoothed RSI, monitors volatility with a dynamically adjusted multiplier, and then plots a color-coded histogram that helps traders see when the RSI is entering strong bullish or bearish territory:
• Smoothed RSI Calculation
The script calculates RSI for a user-defined period and then smooths it with an EMA. This reduces noise in the indicator’s readings.
• Dynamic Average Range (DAR)
The script computes volatility by taking the absolute change of the smoothed RSI, applying two EMAs, and multiplying by a QQE factor. This produces a band around the RSI that adapts to changes in market volatility.
• Histogram Centering and Thresholds
Rather than plotting the RSI itself, the script subtracts 50 from the RSI to center it around zero. Columns are plotted for each bar:
Blue when momentum is significantly above zero (over a threshold value).
Red when momentum is significantly below zero (under a negative threshold).
Gray when momentum is within a neutral range.
• Usage
By observing when columns turn blue or red—and how far they extend above or below zero—traders can quickly gauge the market’s momentum. The horizontal threshold lines (dashed by default) provide clear breakout levels for bullish or bearish conditions, which can help confirm entries or exits based on shifting market sentiment. It is best paired with the AntoQQE - Bars indicator for better chart visualization.
오픈 소스 스크립트
트레이딩뷰의 진정한 정신에 따라, 이 스크립트의 작성자는 이를 오픈소스로 공개하여 트레이더들이 기능을 검토하고 검증할 수 있도록 했습니다. 작성자에게 찬사를 보냅니다! 이 코드는 무료로 사용할 수 있지만, 코드를 재게시하는 경우 하우스 룰이 적용된다는 점을 기억하세요.
면책사항
해당 정보와 게시물은 금융, 투자, 트레이딩 또는 기타 유형의 조언이나 권장 사항으로 간주되지 않으며, 트레이딩뷰에서 제공하거나 보증하는 것이 아닙니다. 자세한 내용은 이용 약관을 참조하세요.
오픈 소스 스크립트
트레이딩뷰의 진정한 정신에 따라, 이 스크립트의 작성자는 이를 오픈소스로 공개하여 트레이더들이 기능을 검토하고 검증할 수 있도록 했습니다. 작성자에게 찬사를 보냅니다! 이 코드는 무료로 사용할 수 있지만, 코드를 재게시하는 경우 하우스 룰이 적용된다는 점을 기억하세요.
면책사항
해당 정보와 게시물은 금융, 투자, 트레이딩 또는 기타 유형의 조언이나 권장 사항으로 간주되지 않으며, 트레이딩뷰에서 제공하거나 보증하는 것이 아닙니다. 자세한 내용은 이용 약관을 참조하세요.