OPEN-SOURCE SCRIPT
Horizontal Grid from Base Price
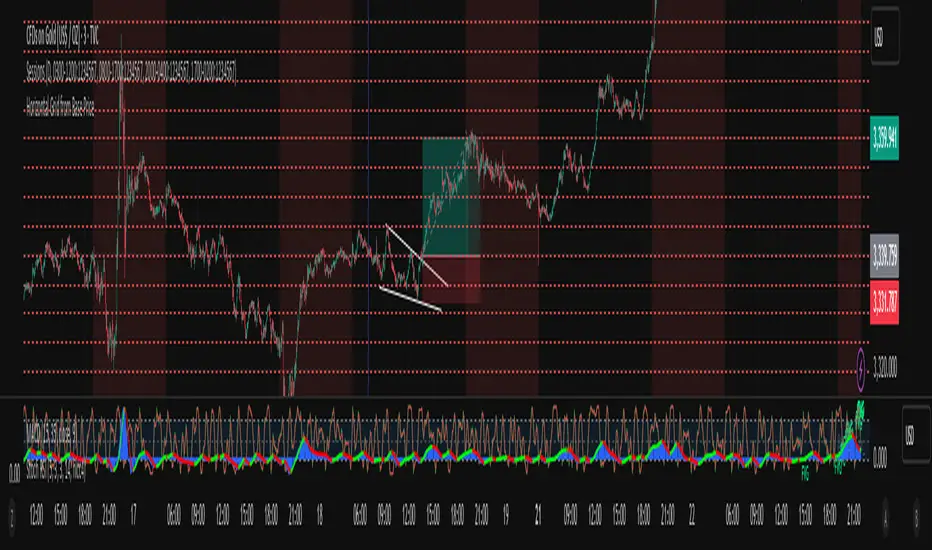
Support & Resistance Indicator function
This inductor is designed to analyze the "resistance line" according to the principle of mother fish technique, with the main purpose of:
• Measure the price swing cycle (Price Swing Cycle)
• analyze the standings of a candle to catch the tempo of the trade
• Used as a decision sponsor in conjunction with Price Action and key zones.
⸻
🛠️ Main features
1. Create Automatic Resistance Boundary
• Based on the open price level of the Day (Initial Session Open) bar.
• It's the main reference point for building a price framework.
2. Set the distance around the resistance line.
• like 100 dots/200 dots/custom
• Provides systematic price tracking (Cycle).
3. Number of lines can be set.
• For example, show 3 lines or more of the top-bottom lines as needed.
4. Customize the color and style of the line.
• The line color can be changed, the line will be in dotted line format according to the user's style.
• Day/night support (Dark/Light Theme)
5. Support for use in conjunction with mother fish techniques.
• Use the line as a base to observe whether the "candle stand above or below the line".
• It is used to help see the behavior of "standing", "loosing", or "flow" of prices on the defensive/resistance line.
6. The default is available immediately.
• The default is based on the current Day bar opening price.
• Round distance, e.g. 200 points, top and bottom, with 3 levels of performance
오픈 소스 스크립트
트레이딩뷰의 진정한 정신에 따라, 이 스크립트의 작성자는 이를 오픈소스로 공개하여 트레이더들이 기능을 검토하고 검증할 수 있도록 했습니다. 작성자에게 찬사를 보냅니다! 이 코드는 무료로 사용할 수 있지만, 코드를 재게시하는 경우 하우스 룰이 적용된다는 점을 기억하세요.
면책사항
해당 정보와 게시물은 금융, 투자, 트레이딩 또는 기타 유형의 조언이나 권장 사항으로 간주되지 않으며, 트레이딩뷰에서 제공하거나 보증하는 것이 아닙니다. 자세한 내용은 이용 약관을 참조하세요.
오픈 소스 스크립트
트레이딩뷰의 진정한 정신에 따라, 이 스크립트의 작성자는 이를 오픈소스로 공개하여 트레이더들이 기능을 검토하고 검증할 수 있도록 했습니다. 작성자에게 찬사를 보냅니다! 이 코드는 무료로 사용할 수 있지만, 코드를 재게시하는 경우 하우스 룰이 적용된다는 점을 기억하세요.
면책사항
해당 정보와 게시물은 금융, 투자, 트레이딩 또는 기타 유형의 조언이나 권장 사항으로 간주되지 않으며, 트레이딩뷰에서 제공하거나 보증하는 것이 아닙니다. 자세한 내용은 이용 약관을 참조하세요.