█ OVERVIEW
Library "e2hray"
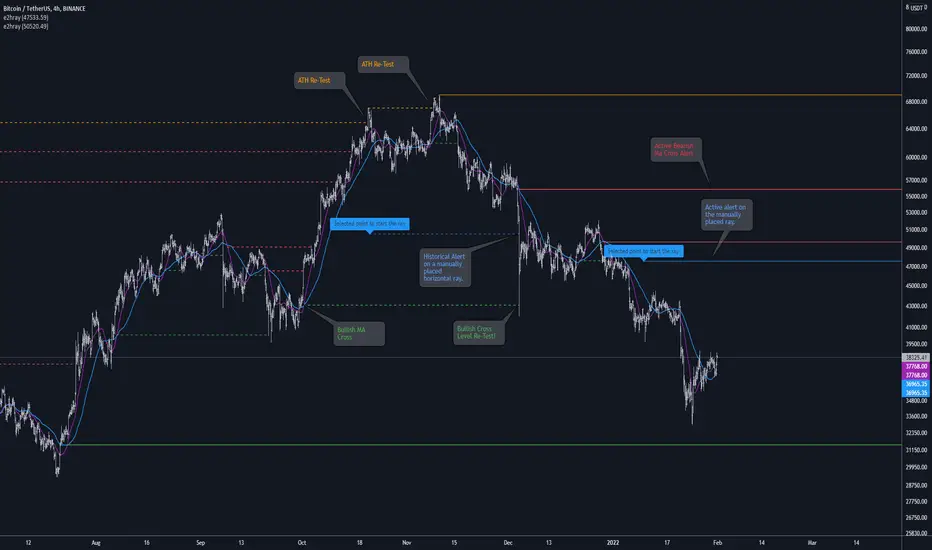
A drawing library that contains the hray() function, which draws a horizontal ray/s with an initial point determined by a specified condition. It plots a ray until it reached the price. The function let you control the visibility of historical levels and setup the alerts.
█ HORIZONTAL RAY FUNCTION
hray(condition, level, color, extend, hist_lines, alert_message, alert_delay, style, hist_style, width, hist_width)
Parameters:
condition: Boolean condition that defines the initial point of a ray
level: Ray price level.
color: Ray color.
extend: (optional) Default value true, current ray levels extend to the right, if false - up to the current bar.
hist_lines: (optional) Default value true, shows historical ray levels that were revisited, default is dashed lines. To avoid alert problems set to 'false' before creating alerts.
alert_message: (optional) Default value string(na), if declared, enables alerts that fire when price revisits a line, using the text specified
alert_delay: (optional) Default value int(0), number of bars to validate the level. Alerts won't trigger if the ray is broken during the 'delay'.
style: (optional) Default value 'line.style_solid'. Ray line style.
hist_style: (optional) Default value 'line.style_dashed'. Historical ray line style.
width: (optional) Default value int(1), ray width in pixels.
hist_width: (optional) Default value int(1), historical ray width in pixels.
Returns: void
█ EXAMPLES
• Example 1. Single horizontal ray from the dynamic input.
Pine Script®

• Example 2. Multiple horizontal rays on the moving averages cross.
Pine Script®

• Example 3. Horizontal ray at the all time highs with an alert.
Pine Script®

Library "e2hray"
A drawing library that contains the hray() function, which draws a horizontal ray/s with an initial point determined by a specified condition. It plots a ray until it reached the price. The function let you control the visibility of historical levels and setup the alerts.
█ HORIZONTAL RAY FUNCTION
hray(condition, level, color, extend, hist_lines, alert_message, alert_delay, style, hist_style, width, hist_width)
Parameters:
condition: Boolean condition that defines the initial point of a ray
level: Ray price level.
color: Ray color.
extend: (optional) Default value true, current ray levels extend to the right, if false - up to the current bar.
hist_lines: (optional) Default value true, shows historical ray levels that were revisited, default is dashed lines. To avoid alert problems set to 'false' before creating alerts.
alert_message: (optional) Default value string(na), if declared, enables alerts that fire when price revisits a line, using the text specified
alert_delay: (optional) Default value int(0), number of bars to validate the level. Alerts won't trigger if the ray is broken during the 'delay'.
style: (optional) Default value 'line.style_solid'. Ray line style.
hist_style: (optional) Default value 'line.style_dashed'. Historical ray line style.
width: (optional) Default value int(1), ray width in pixels.
hist_width: (optional) Default value int(1), historical ray width in pixels.
Returns: void
█ EXAMPLES
• Example 1. Single horizontal ray from the dynamic input.
//@version=5
indicator("hray() example :: Dynamic input ray", overlay = true)
import e2e4mfck/e2hray/1 as e2draw
inputTime = input.time(timestamp("20 Jul 2021 00:00 +0300"), "Date", confirm = true)
inputPrice = input.price(54, 'Price Level', confirm = true)
e2draw.hray(time == inputTime, inputPrice, color.blue, alert_message = 'Ray level re-test!')
var label mark = label.new(inputTime, inputPrice, 'Selected point to start the ray', xloc.bar_time)
• Example 2. Multiple horizontal rays on the moving averages cross.
//@version=5
indicator("hray() example :: MA Cross", overlay = true)
import e2e4mfck/e2hray/1 as e2draw
float sma1 = ta.sma(close, 20)
float sma2 = ta.sma(close, 50)
bullishCross = ta.crossover( sma1, sma2)
bearishCross = ta.crossunder(sma1, sma2)
plot(sma1, 'sma1', color.purple)
plot(sma2, 'sma2', color.blue)
// 1a. We can use 2 function calls to distinguish long and short sides.
e2draw.hray(bullishCross, sma1, color.green, alert_message = 'Bullish Cross Level Broken!', alert_delay = 10)
e2draw.hray(bearishCross, sma2, color.red, alert_message = 'Bearish Cross Level Broken!', alert_delay = 10)
// 1b. Or a single call for both.
// e2draw.hray(bullishCross or bearishCross, sma1, bullishCross ? color.green : color.red)
• Example 3. Horizontal ray at the all time highs with an alert.
//@version=5
indicator("hray() example :: ATH", overlay = true)
import e2e4mfck/e2hray/1 as e2draw
var float ath = 0, ath := math.max(high, ath)
bool newAth = ta.change(ath)
e2draw.hray(nz(newAth[1]), high[1], color.orange, alert_message = 'All Time Highs Tested!', alert_delay = 10)
릴리즈 노트
v2 - xloc context switched from 'bar_index' to 'time'.
- alert_delay should be declared in minutes instead of bars.
- deep history reference bug fixed.
파인 라이브러리
트레이딩뷰의 진정한 정신에 따라, 작성자는 이 파인 코드를 오픈소스 라이브러리로 게시하여 커뮤니티의 다른 파인 프로그래머들이 재사용할 수 있도록 했습니다. 작성자에게 경의를 표합니다! 이 라이브러리는 개인적으로 사용하거나 다른 오픈소스 게시물에서 사용할 수 있지만, 이 코드의 게시물 내 재사용은 하우스 룰에 따라 규제됩니다.
Pisces swimming through the river
All their life against the stream
Searching for a hook to catch on
And see their sun beam
Then suffocate in painful tortures
On cutting tables of callous men
Under a knife of handsome butchers
Emeralds are ripped away
All their life against the stream
Searching for a hook to catch on
And see their sun beam
Then suffocate in painful tortures
On cutting tables of callous men
Under a knife of handsome butchers
Emeralds are ripped away
면책사항
해당 정보와 게시물은 금융, 투자, 트레이딩 또는 기타 유형의 조언이나 권장 사항으로 간주되지 않으며, 트레이딩뷰에서 제공하거나 보증하는 것이 아닙니다. 자세한 내용은 이용 약관을 참조하세요.