OPEN-SOURCE SCRIPT
Madrid Profit Area
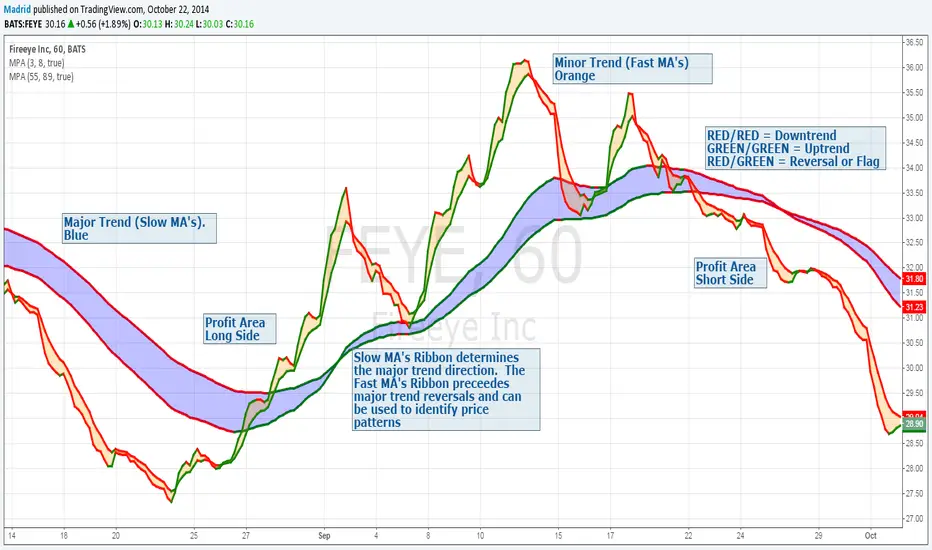
This study displays a ribbon made of two moving averages identified by a filled Area. This provides visual aids to determine the trend direction and pivot points. The moving average will be Red if its value is decreasing, and green if it is increasing. When both MA's are the same color we have a trend direction. If those are different then we have a trend reversal and a pivot point.
If combined with another ribbon then it can be configured so we have a pair of slow MA's and another pair of fast MA's , this can visually determine if the price is in bull or bear territory following the basic rules:
1. Fast MA pair above the slow MA Pair = Bullish
2. Fast MA pair below the slow MA Pair = Bearish
3. If the fast MA crosses over the slow MA it is a Bullish reversal
4. If the fast MA crosses below the the slow MA, it is a Bearish reversal.
The use of the ribbons without the price bars or line reduces the noise inherent to the price
오픈 소스 스크립트
트레이딩뷰의 진정한 정신에 따라, 이 스크립트의 작성자는 이를 오픈소스로 공개하여 트레이더들이 기능을 검토하고 검증할 수 있도록 했습니다. 작성자에게 찬사를 보냅니다! 이 코드는 무료로 사용할 수 있지만, 코드를 재게시하는 경우 하우스 룰이 적용된다는 점을 기억하세요.
면책사항
해당 정보와 게시물은 금융, 투자, 트레이딩 또는 기타 유형의 조언이나 권장 사항으로 간주되지 않으며, 트레이딩뷰에서 제공하거나 보증하는 것이 아닙니다. 자세한 내용은 이용 약관을 참조하세요.
오픈 소스 스크립트
트레이딩뷰의 진정한 정신에 따라, 이 스크립트의 작성자는 이를 오픈소스로 공개하여 트레이더들이 기능을 검토하고 검증할 수 있도록 했습니다. 작성자에게 찬사를 보냅니다! 이 코드는 무료로 사용할 수 있지만, 코드를 재게시하는 경우 하우스 룰이 적용된다는 점을 기억하세요.
면책사항
해당 정보와 게시물은 금융, 투자, 트레이딩 또는 기타 유형의 조언이나 권장 사항으로 간주되지 않으며, 트레이딩뷰에서 제공하거나 보증하는 것이 아닙니다. 자세한 내용은 이용 약관을 참조하세요.