OPEN-SOURCE SCRIPT
TREND 123
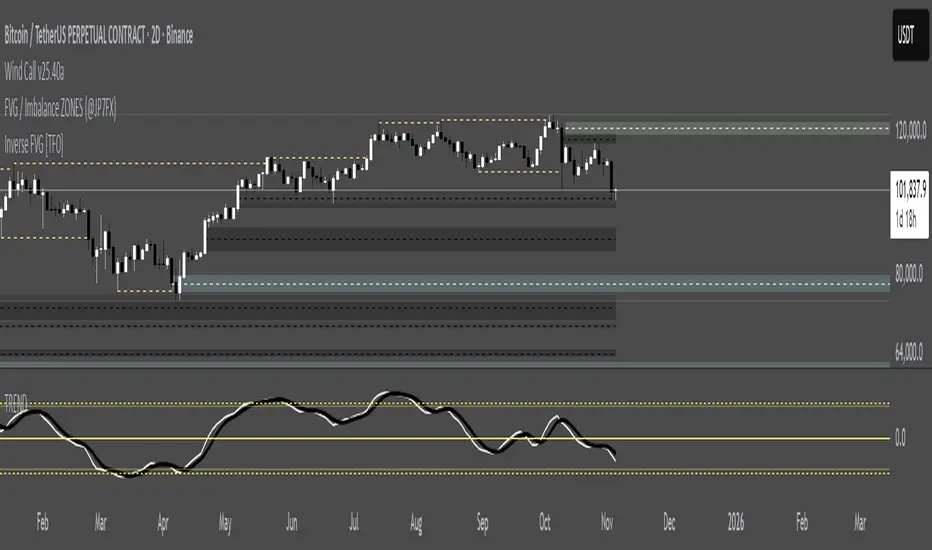
### TREND - Wave Trend Oscillator (Optimized)
This indicator is an optimized version of the classic Wave Trend Oscillator, a powerful tool for identifying market momentum, overbought/oversold conditions, and potential trend shifts. Built on the foundational work of LazyBear, this script has been refined for clarity and enhanced with key features to provide a more comprehensive trading view.
#### Key Features and Functionality
The indicator plots two primary lines, WT1 (Wave Trend 1) and WT2 (Wave Trend 2), in a separate pane below the price chart.
,
Momentum and Trend Identification:
,
WT1 (Blue Line): Represents the faster-moving component, reflecting immediate market momentum.
,
WT2 (Orange Line): Acts as a signal line, a smoothed version of WT1.
,
Crossovers: A cross of WT1 above WT2 is typically interpreted as a bullish signal, while a cross below WT2 suggests a bearish signal.
,
Overbought and Oversold Zones:
The script includes four configurable horizontal lines to define critical zones: two for ,
Overbought (e.g., +60 and +53) and two for Oversold (e.g., -60 and -53).
When the WT lines enter the Overbought zone, it signals that the asset may be due for a pullback. Conversely, entering the Oversold zone suggests a potential bounce.,
,
Sensitivity Control:
A unique ,
Sensitivity Factor input allows users to fine-tune the oscillator's responsiveness to price changes. A lower factor makes the indicator more sensitive, while a higher factor provides smoother, less volatile readings.
,
Visual Enhancements (Configurable):
,
Histogram: An optional histogram plots the difference between WT1 and WT2. This visual aid helps gauge the strength of the current momentum—the larger the bar, the stronger the trend in that direction.
,
Information Table: An optional, dynamic table is displayed on the chart, providing a quick, real-time summary of the indicator's status, including:
,
Current State: Neutral, Overbought (), or Oversold ().
,
Trend: Bullish () or Bearish (), based on the WT1/WT2 crossover.
The current values of WT1 and WT2.,
#### How to Use It
This indicator is best used as a confirmation tool alongside price action or other trend-following indicators.
오픈 소스 스크립트
진정한 트레이딩뷰 정신에 따라 이 스크립트 작성자는 트레이더가 기능을 검토하고 검증할 수 있도록 오픈소스로 공개했습니다. 작성자에게 찬사를 보냅니다! 무료로 사용할 수 있지만 코드를 다시 게시할 경우 하우스 룰이 적용된다는 점을 기억하세요.
면책사항
이 정보와 게시물은 TradingView에서 제공하거나 보증하는 금융, 투자, 거래 또는 기타 유형의 조언이나 권고 사항을 의미하거나 구성하지 않습니다. 자세한 내용은 이용 약관을 참고하세요.
오픈 소스 스크립트
진정한 트레이딩뷰 정신에 따라 이 스크립트 작성자는 트레이더가 기능을 검토하고 검증할 수 있도록 오픈소스로 공개했습니다. 작성자에게 찬사를 보냅니다! 무료로 사용할 수 있지만 코드를 다시 게시할 경우 하우스 룰이 적용된다는 점을 기억하세요.
면책사항
이 정보와 게시물은 TradingView에서 제공하거나 보증하는 금융, 투자, 거래 또는 기타 유형의 조언이나 권고 사항을 의미하거나 구성하지 않습니다. 자세한 내용은 이용 약관을 참고하세요.