INVITE-ONLY SCRIPT
업데이트됨 Z Momentum
Overview
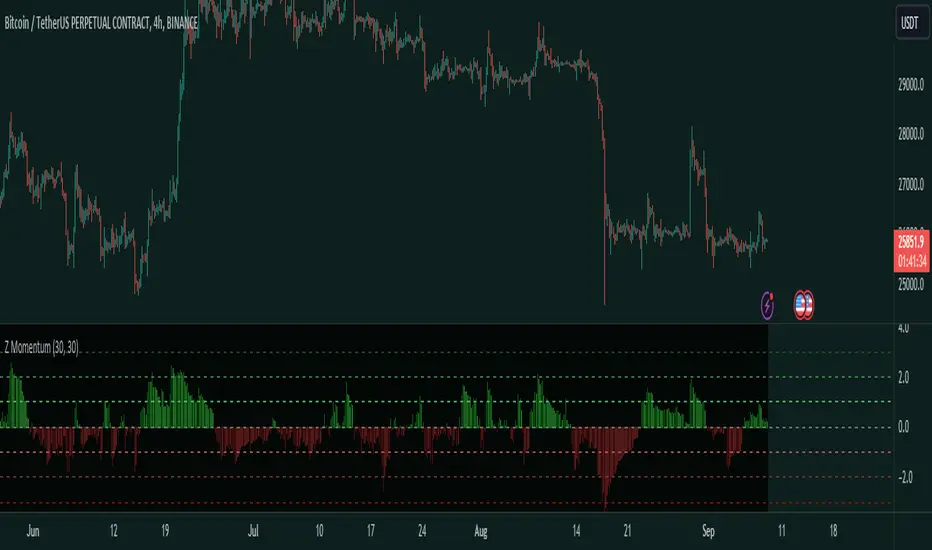
This is a Z-Scored Momentum Indicator. It allows you to understand the volatility of a financial instrument. This indicator calculates and displays the momentum of z-score returns expected value which can be used for finding the regime or for trading inefficiencies.
Indicator Purpose:
The primary purpose of the "Z-Score Momentum" indicator is to help traders identify potential trading opportunities by assessing how far the current returns of a financial instrument deviate from their historical mean returns. This analysis can aid in recognizing overbought or oversold conditions, trend strength, and potential reversal points.
Things to note:[\b]
A Z-Score is a measure of how many standard deviations a data point is away from the mean.
EV: Expected Value, which is basically the average outcome.
When the Z-Score Momentum is above 0, there is a positive Z-Score which indicates that the current returns of the financial instrument are above their historical mean returns over the specified return lookback period, which could mean Positive, Momentum, and in a extremely high Z-Score value, like above +2 Standard deviations it could indicate extreme conditions, but keep in mind this doesn't mean price will go down, this is just the EV.
When the Z-Score Momentum is below 0, there is negative Z-Score which indicates that the current returns of the financial instrument are below their historical mean returns which means you could expect negative returns. In extreme Z-Score situations like -2 Standard deviations this could indicate extreme conditions and the negative momentum is coming to an end.
TDLR:
Interpretation:
The lines on the Indicator highlight the Standard deviations of the Z-Score. It shows the Standard deviations 1,2,3 and -1,-2,-3.


This is a Z-Scored Momentum Indicator. It allows you to understand the volatility of a financial instrument. This indicator calculates and displays the momentum of z-score returns expected value which can be used for finding the regime or for trading inefficiencies.
Indicator Purpose:
The primary purpose of the "Z-Score Momentum" indicator is to help traders identify potential trading opportunities by assessing how far the current returns of a financial instrument deviate from their historical mean returns. This analysis can aid in recognizing overbought or oversold conditions, trend strength, and potential reversal points.
Things to note:[\b]
A Z-Score is a measure of how many standard deviations a data point is away from the mean.
EV: Expected Value, which is basically the average outcome.
When the Z-Score Momentum is above 0, there is a positive Z-Score which indicates that the current returns of the financial instrument are above their historical mean returns over the specified return lookback period, which could mean Positive, Momentum, and in a extremely high Z-Score value, like above +2 Standard deviations it could indicate extreme conditions, but keep in mind this doesn't mean price will go down, this is just the EV.
When the Z-Score Momentum is below 0, there is negative Z-Score which indicates that the current returns of the financial instrument are below their historical mean returns which means you could expect negative returns. In extreme Z-Score situations like -2 Standard deviations this could indicate extreme conditions and the negative momentum is coming to an end.
TDLR:
Interpretation:
- Positive Z-Score: When the Z-score is positive and increasing, it suggests that current returns are above their historical mean, indicating potential positive momentum.
- Negative Z-Score: Conversely, a negative and decreasing Z-score implies that current returns are below their historical mean, suggesting potential negative momentum.
- Extremely High or Low Z-Score: Extremely high (above +2) or low (below -2) Z-scores may indicate extreme market conditions that could be followed by reversals or significant price movements.
The lines on the Indicator highlight the Standard deviations of the Z-Score. It shows the Standard deviations 1,2,3 and -1,-2,-3.
릴리즈 노트
Description Update초대 전용 스크립트
이 스크립트는 작성자가 승인한 사용자만 접근할 수 있습니다. 사용하려면 요청 후 승인을 받아야 하며, 일반적으로 결제 후에 허가가 부여됩니다. 자세한 내용은 아래 작성자의 안내를 따르거나 Traders_Endeavors에게 직접 문의하세요.
트레이딩뷰는 스크립트의 작동 방식을 충분히 이해하고 작성자를 완전히 신뢰하지 않는 이상, 해당 스크립트에 비용을 지불하거나 사용하는 것을 권장하지 않습니다. 커뮤니티 스크립트에서 무료 오픈소스 대안을 찾아보실 수도 있습니다.
작성자 지시 사항
Get access here: https://www.patreon.com/user?u=80987417
Link Tree: linktr.ee/tradersendeavors
Access our indicators: patreon.com/user?u=80987417
Access our indicators: patreon.com/user?u=80987417
면책사항
해당 정보와 게시물은 금융, 투자, 트레이딩 또는 기타 유형의 조언이나 권장 사항으로 간주되지 않으며, 트레이딩뷰에서 제공하거나 보증하는 것이 아닙니다. 자세한 내용은 이용 약관을 참조하세요.
초대 전용 스크립트
이 스크립트는 작성자가 승인한 사용자만 접근할 수 있습니다. 사용하려면 요청 후 승인을 받아야 하며, 일반적으로 결제 후에 허가가 부여됩니다. 자세한 내용은 아래 작성자의 안내를 따르거나 Traders_Endeavors에게 직접 문의하세요.
트레이딩뷰는 스크립트의 작동 방식을 충분히 이해하고 작성자를 완전히 신뢰하지 않는 이상, 해당 스크립트에 비용을 지불하거나 사용하는 것을 권장하지 않습니다. 커뮤니티 스크립트에서 무료 오픈소스 대안을 찾아보실 수도 있습니다.
작성자 지시 사항
Get access here: https://www.patreon.com/user?u=80987417
Link Tree: linktr.ee/tradersendeavors
Access our indicators: patreon.com/user?u=80987417
Access our indicators: patreon.com/user?u=80987417
면책사항
해당 정보와 게시물은 금융, 투자, 트레이딩 또는 기타 유형의 조언이나 권장 사항으로 간주되지 않으며, 트레이딩뷰에서 제공하거나 보증하는 것이 아닙니다. 자세한 내용은 이용 약관을 참조하세요.