OPEN-SOURCE SCRIPT
업데이트됨 Premium Linear Regression - The Quant Science
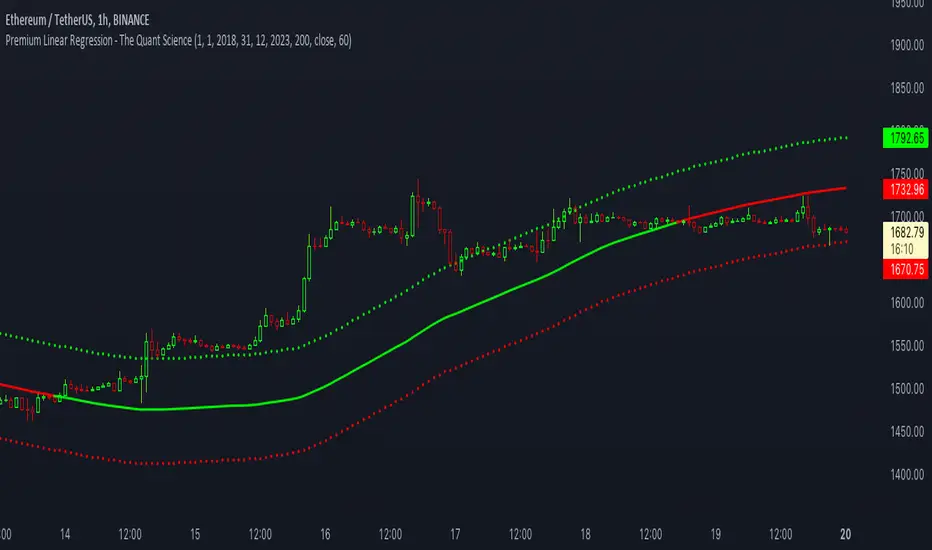
This script calculates the average deviation of the source data from the linear regression. When used with the indicator, it can plot the data line and display various pieces of information, including the maximum average dispersion around the linear regression.
The code includes various user configurations, allowing for the specification of the start and end dates of the period for which to calculate linear regression, the length of the period to use for the calculation, and the data source to use.
The indicator is designed for multi-timeframe use and to facilitate analysis for traders who use regression models in their analysis. It displays a green linear regression line when the price is above the line and a red line when the price is below. The indicator also highlights areas of dispersion around the regression using circles, with bullish areas shown in green and bearish areas shown in red.
릴리즈 노트
Added a function to adjust the linear regression deviation. The indicator adjusts the deviation data calculating only the time period selected by the user interface.오픈 소스 스크립트
트레이딩뷰의 진정한 정신에 따라, 이 스크립트의 작성자는 이를 오픈소스로 공개하여 트레이더들이 기능을 검토하고 검증할 수 있도록 했습니다. 작성자에게 찬사를 보냅니다! 이 코드는 무료로 사용할 수 있지만, 코드를 재게시하는 경우 하우스 룰이 적용된다는 점을 기억하세요.
면책사항
해당 정보와 게시물은 금융, 투자, 트레이딩 또는 기타 유형의 조언이나 권장 사항으로 간주되지 않으며, 트레이딩뷰에서 제공하거나 보증하는 것이 아닙니다. 자세한 내용은 이용 약관을 참조하세요.
오픈 소스 스크립트
트레이딩뷰의 진정한 정신에 따라, 이 스크립트의 작성자는 이를 오픈소스로 공개하여 트레이더들이 기능을 검토하고 검증할 수 있도록 했습니다. 작성자에게 찬사를 보냅니다! 이 코드는 무료로 사용할 수 있지만, 코드를 재게시하는 경우 하우스 룰이 적용된다는 점을 기억하세요.
면책사항
해당 정보와 게시물은 금융, 투자, 트레이딩 또는 기타 유형의 조언이나 권장 사항으로 간주되지 않으며, 트레이딩뷰에서 제공하거나 보증하는 것이 아닙니다. 자세한 내용은 이용 약관을 참조하세요.