OPEN-SOURCE SCRIPT
Bullish/Bearish Body Strength
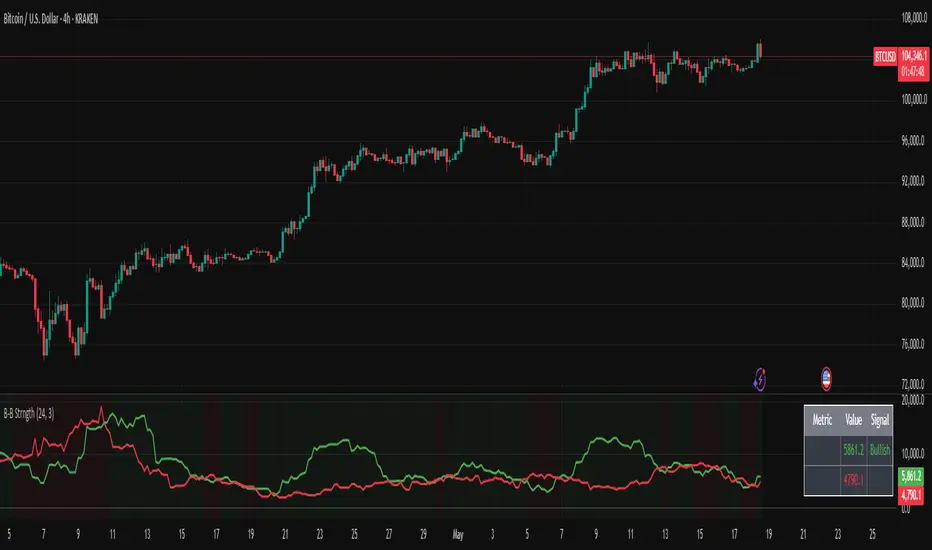
This indicator analyzes candlestick body sizes to measure bullish versus bearish strength over a specified period. Here's what it does:
Features:
- Measures and totals the body sizes of bullish and bearish candles over your chosen lookback period
- Shows the total bullish and bearish body measurements as separate plots
- Calculates and displays a bull/bear ratio (bullish total divided by bearish total)
- Shows the difference between bullish and bearish totals
- Colors the background based on bullish (green) or bearish (red) dominance
- Includes an information table with current values and signals
Customization Options:
- Lookback Period: Set how many bars to analyze (default: 14)
- Normalize by ATR: Option to normalize body sizes by the Average True Range for more consistent measurement across different volatility periods
- Smoothing Period: Apply smoothing to the ratio and difference values
- Display Options: Toggle for showing the bull/bear ratio and bull-bear difference
How to Use:
1. Add the indicator to your chart in TradingView
2. Adjust the lookback period to fit your trading timeframe
3. Watch for:
- When bullish bodies significantly outweigh bearish ones (green dominance)
- When bearish bodies significantly outweigh bullish ones (red dominance)
- Ratio values above 2 (strong bullish signal) or below 0.5 (strong bearish signal)
The indicator provides both visual cues and numerical data to help identify periods of bullish or bearish momentum based on actual price movement rather than just candle count.
오픈 소스 스크립트
트레이딩뷰의 진정한 정신에 따라, 이 스크립트의 작성자는 이를 오픈소스로 공개하여 트레이더들이 기능을 검토하고 검증할 수 있도록 했습니다. 작성자에게 찬사를 보냅니다! 이 코드는 무료로 사용할 수 있지만, 코드를 재게시하는 경우 하우스 룰이 적용된다는 점을 기억하세요.
면책사항
해당 정보와 게시물은 금융, 투자, 트레이딩 또는 기타 유형의 조언이나 권장 사항으로 간주되지 않으며, 트레이딩뷰에서 제공하거나 보증하는 것이 아닙니다. 자세한 내용은 이용 약관을 참조하세요.
오픈 소스 스크립트
트레이딩뷰의 진정한 정신에 따라, 이 스크립트의 작성자는 이를 오픈소스로 공개하여 트레이더들이 기능을 검토하고 검증할 수 있도록 했습니다. 작성자에게 찬사를 보냅니다! 이 코드는 무료로 사용할 수 있지만, 코드를 재게시하는 경우 하우스 룰이 적용된다는 점을 기억하세요.
면책사항
해당 정보와 게시물은 금융, 투자, 트레이딩 또는 기타 유형의 조언이나 권장 사항으로 간주되지 않으며, 트레이딩뷰에서 제공하거나 보증하는 것이 아닙니다. 자세한 내용은 이용 약관을 참조하세요.