OPEN-SOURCE SCRIPT
Historical & Periodic Key Levels

Historical & Periodic Key Levels
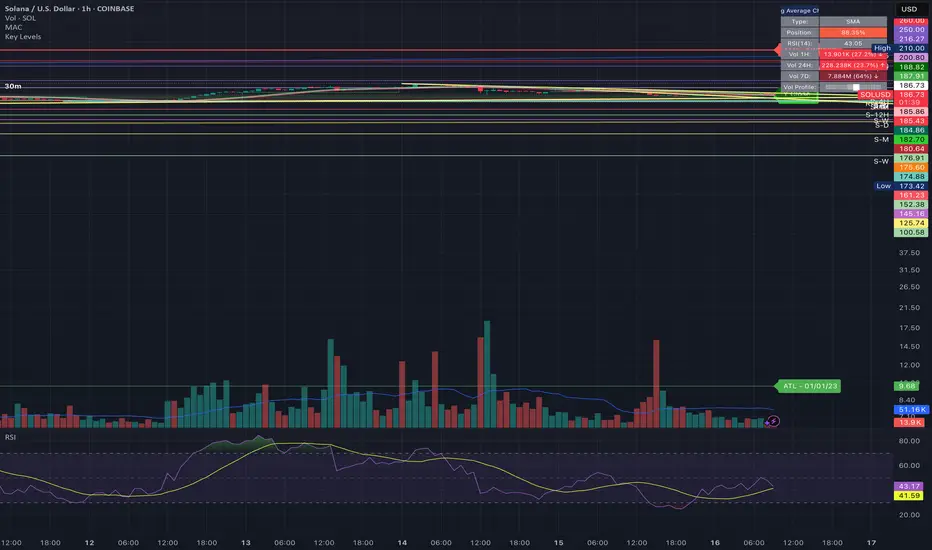
This indicator automatically plots historical key levels (ATH/ATL) and periodic closing levels (Daily, Weekly, Monthly, Yearly). It highlights major price zones frequently used in technical and institutional trading.
Key Features:
Usage:
Inputs:
Notes:
This indicator automatically plots historical key levels (ATH/ATL) and periodic closing levels (Daily, Weekly, Monthly, Yearly). It highlights major price zones frequently used in technical and institutional trading.
Key Features:
- Dynamic ATH/ATL: tracks all-time high/low with date annotation.
- Periodic Closes: previous D/W/M/Y closes with directional coloring.
- Adaptive Colors: green/red based on bullish or bearish close.
- Full Customization: toggle visibility, colors, line width, text alignment, and label text.
- Smart Label Management: prevents overlap by cycling through label styles automatically.
Usage:
- Identify strong support/resistance levels.
- Monitor key closing prices across multiple timeframes.
- Enhance swing trading and long-term analysis with institutional reference levels.
Inputs:
- Levels Visibility: show/hide ATH, ATL, and periodic closes.
- ATH/ATL Style Settings: line colors, label prefix, width, and text alignment.
- Periodic Levels Style: label text (D/W/M/Y), line width, alignment, and bullish/bearish colors.
Notes:
- Levels adjust automatically to the active chart timeframe.
- Lower timeframe levels are hidden when redundant (e.g., daily close on daily chart).
오픈 소스 스크립트
트레이딩뷰의 진정한 정신에 따라, 이 스크립트의 작성자는 이를 오픈소스로 공개하여 트레이더들이 기능을 검토하고 검증할 수 있도록 했습니다. 작성자에게 찬사를 보냅니다! 이 코드는 무료로 사용할 수 있지만, 코드를 재게시하는 경우 하우스 룰이 적용된다는 점을 기억하세요.
면책사항
해당 정보와 게시물은 금융, 투자, 트레이딩 또는 기타 유형의 조언이나 권장 사항으로 간주되지 않으며, 트레이딩뷰에서 제공하거나 보증하는 것이 아닙니다. 자세한 내용은 이용 약관을 참조하세요.
오픈 소스 스크립트
트레이딩뷰의 진정한 정신에 따라, 이 스크립트의 작성자는 이를 오픈소스로 공개하여 트레이더들이 기능을 검토하고 검증할 수 있도록 했습니다. 작성자에게 찬사를 보냅니다! 이 코드는 무료로 사용할 수 있지만, 코드를 재게시하는 경우 하우스 룰이 적용된다는 점을 기억하세요.
면책사항
해당 정보와 게시물은 금융, 투자, 트레이딩 또는 기타 유형의 조언이나 권장 사항으로 간주되지 않으며, 트레이딩뷰에서 제공하거나 보증하는 것이 아닙니다. 자세한 내용은 이용 약관을 참조하세요.