OPEN-SOURCE SCRIPT
Awesome Oscillator Twin Peaks Strategy
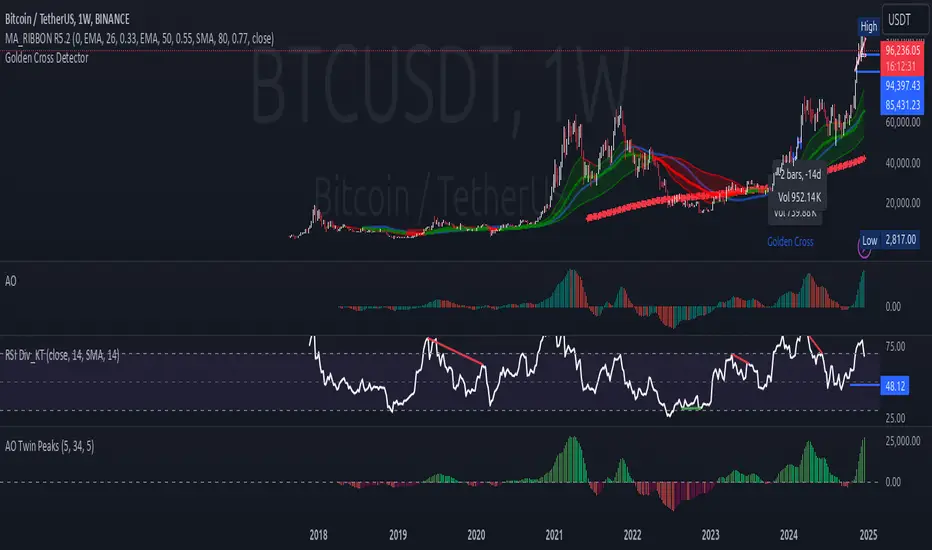
1. The indicator identifies both bullish and bearish twin peaks:
- Bullish: Two consecutive valleys below zero, where the second valley is higher than the first
- Bearish: Two consecutive peaks above zero, where the second peak is lower than the first
2. Visual elements:
- AO histogram with color-coding for increasing/decreasing values
- Triangle markers for confirmed twin peak signals
- Zero line for reference
- Customizable colors through inputs
3. Built-in safeguards:
- Minimum separation between peaks to avoid false signals
- Maximum time window for pattern completion
- Clear signal reset conditions
4. Alert conditions for both bullish and bearish signals
To use this indicator:
1. Add it to your TradingView chart
2. Customize the input parameters if needed
3. Look for triangle markers that indicate confirmed twin peak patterns
4. Optional: Set up alerts based on the signal conditions
오픈 소스 스크립트
트레이딩뷰의 진정한 정신에 따라, 이 스크립트의 작성자는 이를 오픈소스로 공개하여 트레이더들이 기능을 검토하고 검증할 수 있도록 했습니다. 작성자에게 찬사를 보냅니다! 이 코드는 무료로 사용할 수 있지만, 코드를 재게시하는 경우 하우스 룰이 적용된다는 점을 기억하세요.
면책사항
해당 정보와 게시물은 금융, 투자, 트레이딩 또는 기타 유형의 조언이나 권장 사항으로 간주되지 않으며, 트레이딩뷰에서 제공하거나 보증하는 것이 아닙니다. 자세한 내용은 이용 약관을 참조하세요.
오픈 소스 스크립트
트레이딩뷰의 진정한 정신에 따라, 이 스크립트의 작성자는 이를 오픈소스로 공개하여 트레이더들이 기능을 검토하고 검증할 수 있도록 했습니다. 작성자에게 찬사를 보냅니다! 이 코드는 무료로 사용할 수 있지만, 코드를 재게시하는 경우 하우스 룰이 적용된다는 점을 기억하세요.
면책사항
해당 정보와 게시물은 금융, 투자, 트레이딩 또는 기타 유형의 조언이나 권장 사항으로 간주되지 않으며, 트레이딩뷰에서 제공하거나 보증하는 것이 아닙니다. 자세한 내용은 이용 약관을 참조하세요.