OPEN-SOURCE SCRIPT
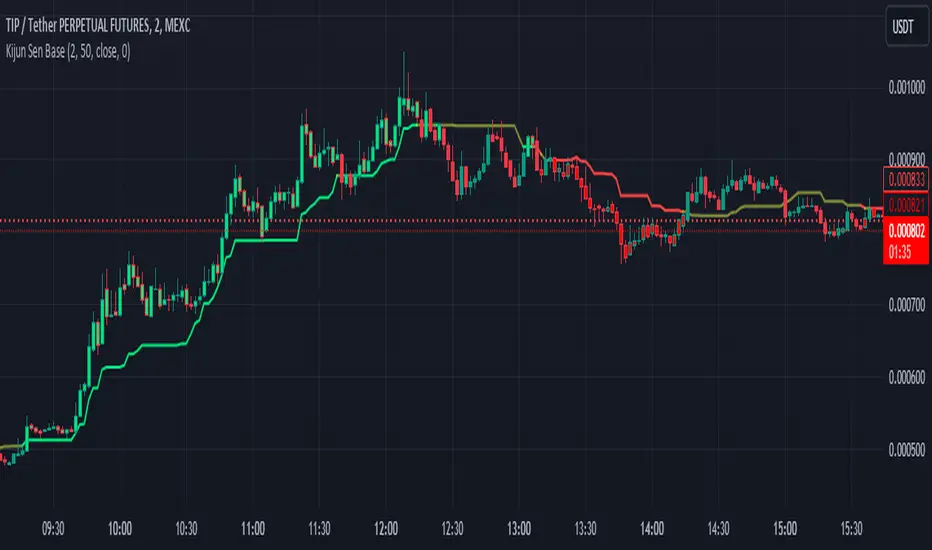
업데이트됨 Kijun Sen Base

What is Kijun Sen?
Kijun-sen also means "base line" and is the mid-point of the 26-period high and low. Kijun-sen is typically used in conjunction with Tenkan-sen (conversion line) or (the 9-period midpoint price) to generate trade signals when they cross. Kijun-sen is typically used in conjunction with the other Ichimoku indicators.
What is the Kijun Sen Base?
The Kijun Sen Base is the center line in the Ichimoku Cloud Indicator. We have taken that line out and made it an indicator on its own, color-coded it, and allowed traders to track the price for a clean and simple base filter.
https://www.tradingview.com/x/fqt8UOkI/
Is this a Moving Average?
NO
The Difference Between Kijun-sen (Base Line) and a Simple Moving Average (SMA)
The Kijun-sen is a midpoint of the high and low prices over the last 26 periods. This is not an average.
https://www.tradingview.com/x/hdwUsg3Q/
How do I trade with this Indicator?
Unless there's a lot of recent price movement, enough to pull the price away from the 26-period midpoint, the Kijun-sen will often trade near and intersect with the current price. At times like these, it is not an ideal tool for helping with trend direction. If, however, there is a strong price move away from Kijun Sen and the gap between Kijun Sen and the price is "increasing" or "widening", this is an indication that a trend is forming.
https://www.tradingview.com/x/3IqWQXbA/
Kijun Sen Base can be used to confirm a trend and is a clean addition to other indicators the trader may use on their charts while at the same time keeping the chart less cluttered.
Happy Trading and Good Luck!
릴리즈 노트
Fixed minor bugsAdded Color Coding To Candles
Added Moving Average confirmation
Added on / off for Moving Average (shown on chart)
오픈 소스 스크립트
트레이딩뷰의 진정한 정신에 따라, 이 스크립트의 작성자는 이를 오픈소스로 공개하여 트레이더들이 기능을 검토하고 검증할 수 있도록 했습니다. 작성자에게 찬사를 보냅니다! 이 코드는 무료로 사용할 수 있지만, 코드를 재게시하는 경우 하우스 룰이 적용된다는 점을 기억하세요.
Join our DISCORD for more free private indicators or if you need TRAINING on our Indicators.
discord.com/invite/nZfY854MXR
Become a Patron
patreon.com/nnamdert
discord.com/invite/nZfY854MXR
Become a Patron
patreon.com/nnamdert
면책사항
해당 정보와 게시물은 금융, 투자, 트레이딩 또는 기타 유형의 조언이나 권장 사항으로 간주되지 않으며, 트레이딩뷰에서 제공하거나 보증하는 것이 아닙니다. 자세한 내용은 이용 약관을 참조하세요.