PROTECTED SOURCE SCRIPT
JackFinance:Vegas Dual Channel
Vegas Tunnel Indicator - Technical Documentation
Overview
The Vegas Tunnel is a technical analysis indicator utilizing multiple exponential moving averages (EMAs) to identify market trends and potential trading opportunities. The system employs five EMAs organized into three distinct groups for multi-timeframe analysis.
Component Structure
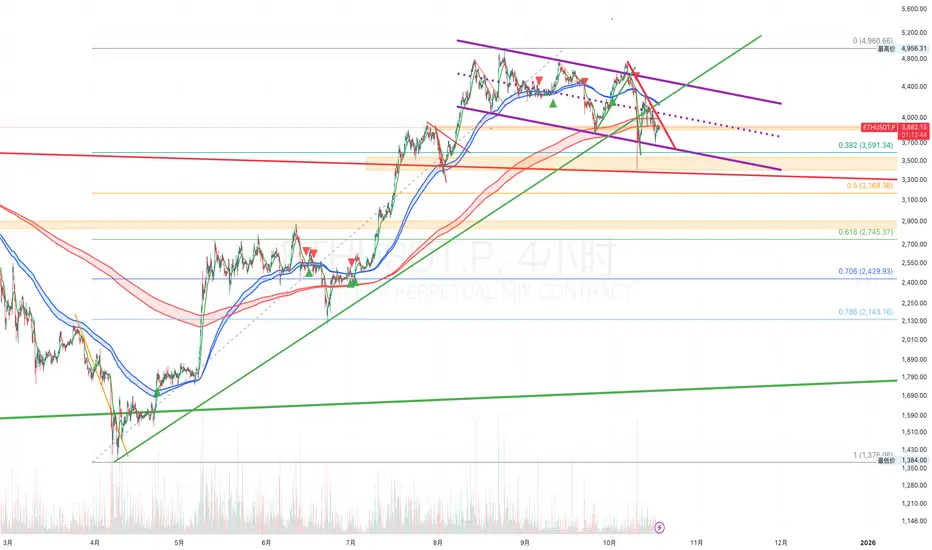
Filter Line: 12-period EMA (green) serving as short-term trend indicator
Channel A: 144-period and 169-period EMAs (blue) defining medium-term trend direction
Channel B: 576-period and 676-period EMAs (red) establishing long-term trend context
Operational Methodology
The indicator generates trading signals based on the relative positioning and interactions between these EMA groups. Price position above both channels indicates bullish market conditions, while position below both channels suggests bearish conditions. Crossovers between the Filter Line and Channel A provide potential entry and exit signals, with Channel B serving as confirmation for major trend direction.
Application Guidelines
This indicator is optimized for swing trading and position trading strategies on timeframes of one hour or higher. Traders should consider the slope and spacing of the channels as indicators of trend strength. The tunnel areas between EMAs function as dynamic support and resistance zones.
Parameter Customization
All EMA periods are adjustable through the input parameters, allowing traders to optimize settings for specific instruments and trading styles. Default values are based on Fibonacci-derived numbers that have demonstrated historical significance in technical analysis.
Overview
The Vegas Tunnel is a technical analysis indicator utilizing multiple exponential moving averages (EMAs) to identify market trends and potential trading opportunities. The system employs five EMAs organized into three distinct groups for multi-timeframe analysis.
Component Structure
Filter Line: 12-period EMA (green) serving as short-term trend indicator
Channel A: 144-period and 169-period EMAs (blue) defining medium-term trend direction
Channel B: 576-period and 676-period EMAs (red) establishing long-term trend context
Operational Methodology
The indicator generates trading signals based on the relative positioning and interactions between these EMA groups. Price position above both channels indicates bullish market conditions, while position below both channels suggests bearish conditions. Crossovers between the Filter Line and Channel A provide potential entry and exit signals, with Channel B serving as confirmation for major trend direction.
Application Guidelines
This indicator is optimized for swing trading and position trading strategies on timeframes of one hour or higher. Traders should consider the slope and spacing of the channels as indicators of trend strength. The tunnel areas between EMAs function as dynamic support and resistance zones.
Parameter Customization
All EMA periods are adjustable through the input parameters, allowing traders to optimize settings for specific instruments and trading styles. Default values are based on Fibonacci-derived numbers that have demonstrated historical significance in technical analysis.
보호된 스크립트입니다
이 스크립트는 비공개 소스로 게시됩니다. 하지만 이를 자유롭게 제한 없이 사용할 수 있습니다 – 자세한 내용은 여기에서 확인하세요.
Track trend initiation and strictly control trading decisions. Focus on practical analysis of cryptocurrencies and US stocks, transaction review and strategy sharing
TG:t.me/jackfinance888
TG:t.me/jackfinance888
면책사항
해당 정보와 게시물은 금융, 투자, 트레이딩 또는 기타 유형의 조언이나 권장 사항으로 간주되지 않으며, 트레이딩뷰에서 제공하거나 보증하는 것이 아닙니다. 자세한 내용은 이용 약관을 참조하세요.