PROTECTED SOURCE SCRIPT
Leonidas Volatility Oscillator
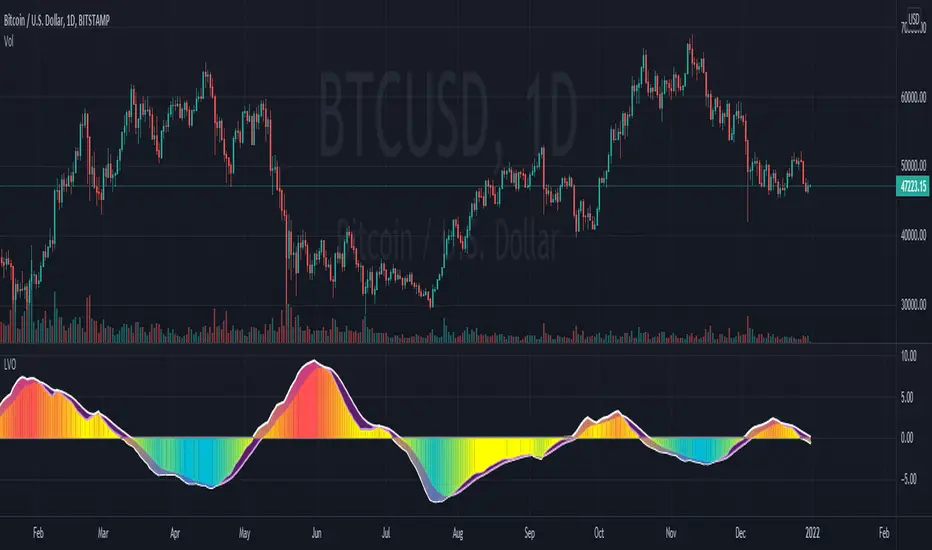
This indicator is showing the volatility based on ATR or Historical Volatility.
Volatility is one of the most powerful tools to catch explosive moves or identify when the market is in consolidation/distribution phase.
How to use this indicator:
Colors:
Blue Color is they most important color for this indicator .
This color is suggesting the volatility is reaching the lowest point the market is in consolidation/distribution phase. Depending of the time frame after this phase you will see an expansion.

Yellow/Red Color
Usually we will see this when the market is trending.

Trend.
This indicator is interesting because you will know if the volatility is trending powerful to keep your positions or ride the trend .

This indicator will not tell you when to sell or buy.
This indicator will help you to identify explosive moves, consolidation/distribution phases.
Volatility is one of the most powerful tools to catch explosive moves or identify when the market is in consolidation/distribution phase.
How to use this indicator:
Colors:
Blue Color is they most important color for this indicator .
This color is suggesting the volatility is reaching the lowest point the market is in consolidation/distribution phase. Depending of the time frame after this phase you will see an expansion.
Yellow/Red Color
Usually we will see this when the market is trending.
Trend.
This indicator is interesting because you will know if the volatility is trending powerful to keep your positions or ride the trend .
This indicator will not tell you when to sell or buy.
This indicator will help you to identify explosive moves, consolidation/distribution phases.
보호된 스크립트입니다
이 스크립트는 비공개 소스로 게시됩니다. 하지만 이를 자유롭게 제한 없이 사용할 수 있습니다 – 자세한 내용은 여기에서 확인하세요.
Trading for living!
면책사항
해당 정보와 게시물은 금융, 투자, 트레이딩 또는 기타 유형의 조언이나 권장 사항으로 간주되지 않으며, 트레이딩뷰에서 제공하거나 보증하는 것이 아닙니다. 자세한 내용은 이용 약관을 참조하세요.
보호된 스크립트입니다
이 스크립트는 비공개 소스로 게시됩니다. 하지만 이를 자유롭게 제한 없이 사용할 수 있습니다 – 자세한 내용은 여기에서 확인하세요.
Trading for living!
면책사항
해당 정보와 게시물은 금융, 투자, 트레이딩 또는 기타 유형의 조언이나 권장 사항으로 간주되지 않으며, 트레이딩뷰에서 제공하거나 보증하는 것이 아닙니다. 자세한 내용은 이용 약관을 참조하세요.