PROTECTED SOURCE SCRIPT
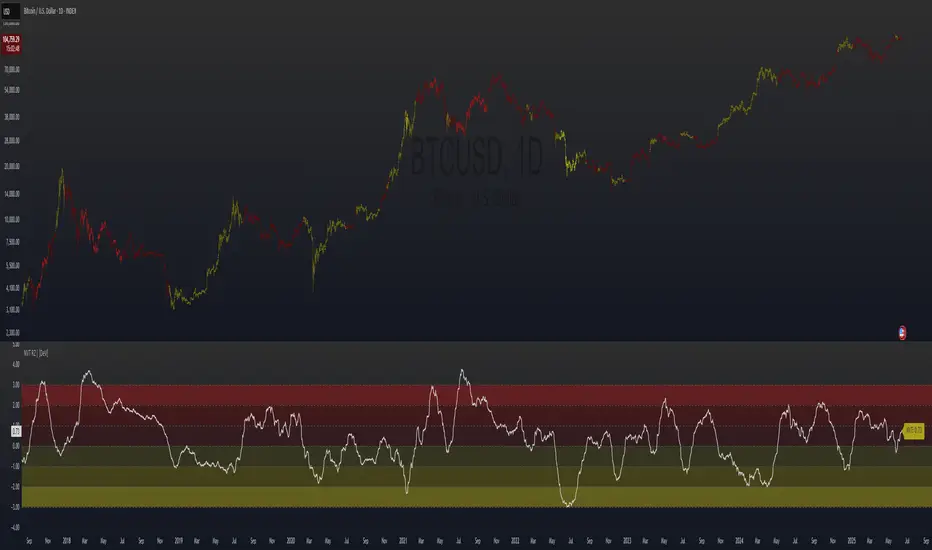
NVT Ratio Z-Score | [DeV]
**DISCLAIMER: This indicator is not trend following, so it SHOULD NOT be a buy/sell signal or used as a stand alone indicator to tell you to buy or sell. It's simply giving insight into potential overbought or oversold market conditions, and should be used in conjunction with other market analysis tools to give you an idea of possible market reversals.**
The NVT Ratio Z-Score is a unique on-chain valuation tool that helps users assess whether Bitcoin is potentially overbought or oversold relative to its network fundamentals. This indicator calculates the Network Value to Transactions (NVT) ratio, which compares Bitcoin’s market capitalization (price × circulating supply) to the USD-denominated daily transaction volume on the network. To improve clarity and remove short-term noise, the NVT value is smoothed using a customizable moving average (NVT Smoothing Period). The smoothed value is then normalized using a Z-score over a rolling period (Normalization Lookback Period), allowing for easier comparison of extreme deviations over time. This normalization makes it possible to spot historically high or low valuation zones with consistency.
While the NVT Ratio Z-Score is not a price action or trend-following indicator, it excels as a valuation-based supplemental tool. By using this indicator alongside your existing technical setups—such as momentum oscillators (like RSI or MACD), moving averages, or volume profiles—you can gain a deeper perspective on whether the broader market is operating in an overheated or undervalued state.
Interpretation is straightforward: the lower the Z-score dips into negative territory, the more oversold the market may be, potentially indicating a bottoming process or future upward reversal. Conversely, higher Z-scores suggest the market is becoming overheated or overbought, which can precede pullbacks or broader downtrends. However, it’s crucial to remember: this is not a trend indicator. Overbought conditions don’t guarantee immediate downturns, and oversold conditions don’t guarantee immediate rallies. Markets can remain extended in either direction for prolonged periods.
Use the NVT Ratio Z-Score to contextualize price moves and strengthen conviction when your other tools show signals aligning with extreme valuation zones. This indicator is especially helpful for swing traders, long-term investors, and those analyzing Bitcoin through a macro-on-chain lens.
보호된 스크립트입니다
이 스크립트는 비공개 소스로 게시됩니다. 하지만 이를 자유롭게 제한 없이 사용할 수 있습니다 – 자세한 내용은 여기에서 확인하세요.
면책사항
해당 정보와 게시물은 금융, 투자, 트레이딩 또는 기타 유형의 조언이나 권장 사항으로 간주되지 않으며, 트레이딩뷰에서 제공하거나 보증하는 것이 아닙니다. 자세한 내용은 이용 약관을 참조하세요.
면책사항
해당 정보와 게시물은 금융, 투자, 트레이딩 또는 기타 유형의 조언이나 권장 사항으로 간주되지 않으며, 트레이딩뷰에서 제공하거나 보증하는 것이 아닙니다. 자세한 내용은 이용 약관을 참조하세요.