INVITE-ONLY SCRIPT
CUO WITH BLUE BULL
// Core Ultra Oscillator (CUO) with Blue Bull
//
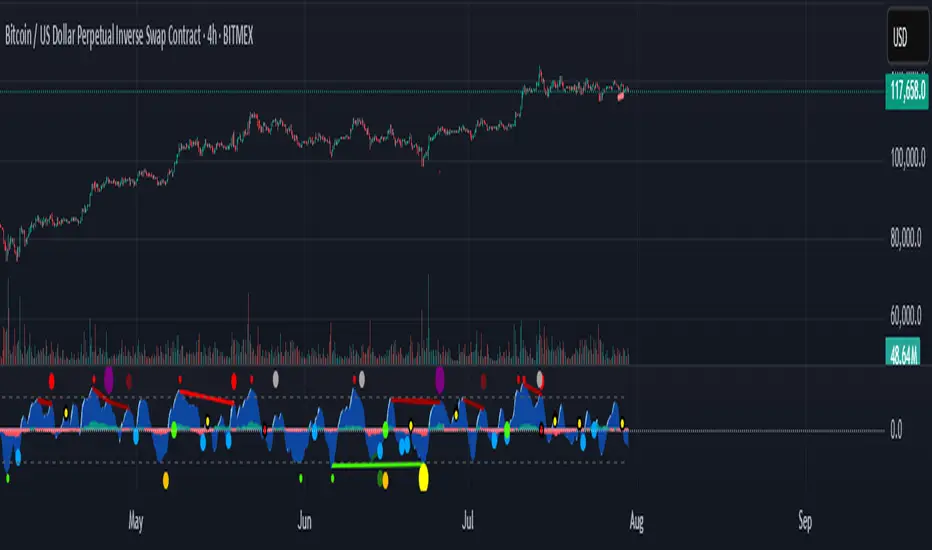
// The Core Ultra Oscillator (CUO) is a technical analysis tool designed to identify potential trend reversals and breakout opportunities by combining momentum, volume, and divergence analysis.
// It aims to enhance divergence-based trading by incorporating additional filters to reduce false signals during strong market trends.
// The indicator integrates WaveTrend Oscillator, regular volume and Cumulative Volume Delta (CVD), generating unique divergence signals enhanced with trend filters to allow greater flexibility in trading style and market type.
//
// Key Features:
// - WaveTrend Oscillator: Plots momentum with customizable overbought and oversold levels, displaying buy (green dots) and sell (red dots) signals for prints in extreme zones.
// - Divergence Detection: Identifies regular and hidden bullish/bearish divergences on WaveTrend and CVD, using green/red lines to connect fractal points for potential trend reversals.
// - Cumulative Volume Delta (CVD): Measures buying and selling pressure with smoothed, normalized delta, enhanced by trend and slope filters for signal reliability.
// - Trend Shift Dots:
// - Green White Dot: Indicates the end of a bearish CVD trend, suggesting a potential bullish shift.
// - Black Dot (Red Center): Signals the end of a bullish CVD trend, indicating a potential bearish shift.
// - Seven Unique Dot Signals:
// - Blue Dot (Blue Bull): Highlights potential bullish breakouts based on accumulated momentum.
// - Yellow Dot (Gold Extreme Buy): Marks potential buying opportunities near market bottoms, often following an amber dot.
// - Purple Dot (Extreme Sell): Identifies high-probability sell signals using divergence and trend weakness filters.
// - Black Dot (Yellow Center): Targets first sign of weakness after a strong bullish trend ends, aiming to capture significant selloffs.
// - Dark Blue Dot: Signals peaks in oversold regions after a bullish trend has ended and momentum has flipped towards the bears.
// - Dark Grey Dot: Warns of potential tops via CVD bearish divergences, ideally confirmed with Purple Dot or regular divergences.
// - Amber Dot: Indicates potential bottoms via CVD bullish divergences, to be confirmed with Yellow Dot or regular divergences.
// - Comprehensive Alerts: Includes 15 alert conditions for WaveTrend, CVD, and dot signals to support real-time trading decisions.
//
// How to Use:
// - Apply the indicator to any chart to monitor momentum, volume, and divergences.
// - Adjust Trend momentum, WaveTrend, CVD, and trend thinning parameters through input settings.
// - Use dot signals and divergence lines to time trade entries and exits.
// - Configure alerts for real-time notifications of key signals.
//
// Note: This indicator is for informational purposes only and does not constitute financial advice. Users are encouraged to backtest thoroughly and evaluate the indicator’s performance in their trading strategy.
//
// The Core Ultra Oscillator (CUO) is a technical analysis tool designed to identify potential trend reversals and breakout opportunities by combining momentum, volume, and divergence analysis.
// It aims to enhance divergence-based trading by incorporating additional filters to reduce false signals during strong market trends.
// The indicator integrates WaveTrend Oscillator, regular volume and Cumulative Volume Delta (CVD), generating unique divergence signals enhanced with trend filters to allow greater flexibility in trading style and market type.
//
// Key Features:
// - WaveTrend Oscillator: Plots momentum with customizable overbought and oversold levels, displaying buy (green dots) and sell (red dots) signals for prints in extreme zones.
// - Divergence Detection: Identifies regular and hidden bullish/bearish divergences on WaveTrend and CVD, using green/red lines to connect fractal points for potential trend reversals.
// - Cumulative Volume Delta (CVD): Measures buying and selling pressure with smoothed, normalized delta, enhanced by trend and slope filters for signal reliability.
// - Trend Shift Dots:
// - Green White Dot: Indicates the end of a bearish CVD trend, suggesting a potential bullish shift.
// - Black Dot (Red Center): Signals the end of a bullish CVD trend, indicating a potential bearish shift.
// - Seven Unique Dot Signals:
// - Blue Dot (Blue Bull): Highlights potential bullish breakouts based on accumulated momentum.
// - Yellow Dot (Gold Extreme Buy): Marks potential buying opportunities near market bottoms, often following an amber dot.
// - Purple Dot (Extreme Sell): Identifies high-probability sell signals using divergence and trend weakness filters.
// - Black Dot (Yellow Center): Targets first sign of weakness after a strong bullish trend ends, aiming to capture significant selloffs.
// - Dark Blue Dot: Signals peaks in oversold regions after a bullish trend has ended and momentum has flipped towards the bears.
// - Dark Grey Dot: Warns of potential tops via CVD bearish divergences, ideally confirmed with Purple Dot or regular divergences.
// - Amber Dot: Indicates potential bottoms via CVD bullish divergences, to be confirmed with Yellow Dot or regular divergences.
// - Comprehensive Alerts: Includes 15 alert conditions for WaveTrend, CVD, and dot signals to support real-time trading decisions.
//
// How to Use:
// - Apply the indicator to any chart to monitor momentum, volume, and divergences.
// - Adjust Trend momentum, WaveTrend, CVD, and trend thinning parameters through input settings.
// - Use dot signals and divergence lines to time trade entries and exits.
// - Configure alerts for real-time notifications of key signals.
//
// Note: This indicator is for informational purposes only and does not constitute financial advice. Users are encouraged to backtest thoroughly and evaluate the indicator’s performance in their trading strategy.
초대 전용 스크립트
이 스크립트는 작성자가 승인한 사용자만 접근할 수 있습니다. 사용하려면 요청을 보내고 승인을 받아야 합니다. 일반적으로 결제 후에 승인이 이루어집니다. 자세한 내용은 아래 작성자의 지침을 따르거나 GreenIce_Firefall에게 직접 문의하세요.
트레이딩뷰는 스크립트 작성자를 완전히 신뢰하고 스크립트 작동 방식을 이해하지 않는 한 스크립트 비용을 지불하거나 사용하지 않는 것을 권장하지 않습니다. 무료 오픈소스 대체 스크립트는 커뮤니티 스크립트에서 찾을 수 있습니다.
작성자 지시 사항
Email me at greenicefirefall@gmail.com
면책사항
이 정보와 게시물은 TradingView에서 제공하거나 보증하는 금융, 투자, 거래 또는 기타 유형의 조언이나 권고 사항을 의미하거나 구성하지 않습니다. 자세한 내용은 이용 약관을 참고하세요.