PROTECTED SOURCE SCRIPT
Universally Applicable Valuation Indicator
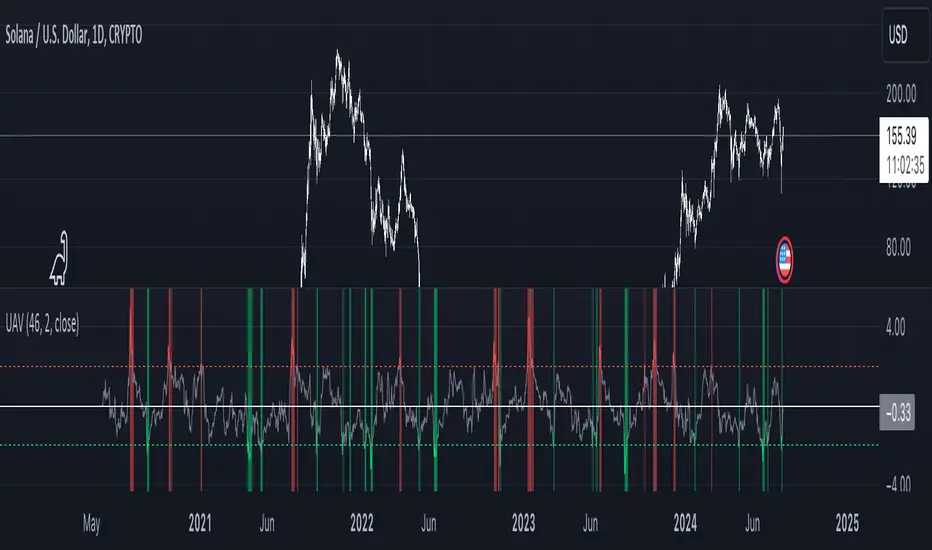
The UAV indicator utilizes a z-score analysis of the Relative Strength Index (RSI) to offer insights into current market conditions.
By comparing the current z-score to its historical distribution, the indicator generates signals that highlight potential overbought or oversold areas.
It features clear visual cues, with color changes occurring as the score crosses plotted standard deviation lines, making it easier to identify potential entry and exit points across all assets and timeframes.
보호된 스크립트입니다
이 스크립트는 비공개 소스로 게시됩니다. 하지만 이를 자유롭게 제한 없이 사용할 수 있습니다 – 자세한 내용은 여기에서 확인하세요.
면책사항
해당 정보와 게시물은 금융, 투자, 트레이딩 또는 기타 유형의 조언이나 권장 사항으로 간주되지 않으며, 트레이딩뷰에서 제공하거나 보증하는 것이 아닙니다. 자세한 내용은 이용 약관을 참조하세요.
면책사항
해당 정보와 게시물은 금융, 투자, 트레이딩 또는 기타 유형의 조언이나 권장 사항으로 간주되지 않으며, 트레이딩뷰에서 제공하거나 보증하는 것이 아닙니다. 자세한 내용은 이용 약관을 참조하세요.