OPEN-SOURCE SCRIPT
업데이트됨 Moving Average and Pearson Levels
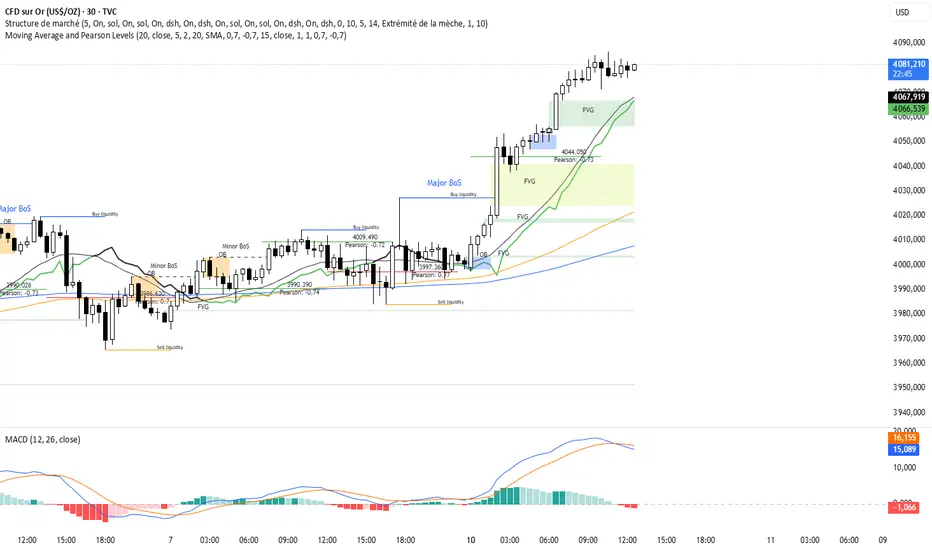
Moving Average and Pearson Levels Indicator
This Pine Script indicator combines a customizable moving average (MA) with Pearson correlation analysis to provide traders with deeper insights into trends and key reference levels. It overlays a Pearson-adjusted moving average on price charts and highlights levels based on correlation for potential trading opportunities. With flexible parameters, it adapts to various trading styles.
Key Features
Pearson-Adjusted Moving Average
Combines a basic MA (SMA, EMA, WMA, or VWMA) with a Pearson correlation adjustment to reflect trend strength.
Adjustable: MA length, price source, smoothing, and line thickness.
Optional color changes based on trends (positive/negative).
Pearson Correlation Levels
Plots smoothed Pearson correlation with upper/lower thresholds to signal strong or weak trends.
Marks entry levels with price labels and dynamic colors when thresholds are crossed.
Customizable: Pearson length, smoothing, thresholds, and colors.
Reference Levels and Alerts
Optional dotted lines for upper, lower, and zero correlation thresholds.
Alerts for bullish MA signals (crossing the lower threshold) and bearish signals (crossing below the upper threshold).
How It Works
Moving Average: Calculates a standard moving average enhanced by a Pearson adjustment based on price trends over a given period.
Pearson Levels: Computes the strength of correlation, smoothed for better readability, and plots price lines at threshold crossings.
Visualization: Displays the MA and levels with trend-reactive colors and optional reference lines.
Usage
Ideal for traders who combine traditional MAs with statistical trend analysis.
Adjust the MA type and Pearson length for short-term or long-term strategies.
Use correlation levels for reversal signals or trend confirmation.
Customization Options
MA Parameters: Select the type, length, and smoothing of the MA; toggle visibility and color changes.
Pearson Levels: Adjust thresholds, line thickness, and label colors.
Display Options: Show/hide reference lines and the standard MA for comparison purposes.
Example Settings
MA Length: 20
Type: EMA
Pearson Length: 15
Thresholds: 0.7/-0.7
Colors: Positive (black), Negative (green), Levels (gray)
Notes
Optimize based on your preferred timeframe.
Adjust smoothing to balance responsiveness and clarity.
Try it out, customize it to your needs, and enhance your trading setup! Feedback and suggestions are welcome.
릴리즈 노트
Modification pour blocage오픈 소스 스크립트
트레이딩뷰의 진정한 정신에 따라, 이 스크립트의 작성자는 이를 오픈소스로 공개하여 트레이더들이 기능을 검토하고 검증할 수 있도록 했습니다. 작성자에게 찬사를 보냅니다! 이 코드는 무료로 사용할 수 있지만, 코드를 재게시하는 경우 하우스 룰이 적용된다는 점을 기억하세요.
면책사항
해당 정보와 게시물은 금융, 투자, 트레이딩 또는 기타 유형의 조언이나 권장 사항으로 간주되지 않으며, 트레이딩뷰에서 제공하거나 보증하는 것이 아닙니다. 자세한 내용은 이용 약관을 참조하세요.
오픈 소스 스크립트
트레이딩뷰의 진정한 정신에 따라, 이 스크립트의 작성자는 이를 오픈소스로 공개하여 트레이더들이 기능을 검토하고 검증할 수 있도록 했습니다. 작성자에게 찬사를 보냅니다! 이 코드는 무료로 사용할 수 있지만, 코드를 재게시하는 경우 하우스 룰이 적용된다는 점을 기억하세요.
면책사항
해당 정보와 게시물은 금융, 투자, 트레이딩 또는 기타 유형의 조언이나 권장 사항으로 간주되지 않으며, 트레이딩뷰에서 제공하거나 보증하는 것이 아닙니다. 자세한 내용은 이용 약관을 참조하세요.