OPEN-SOURCE SCRIPT
HTF Trend Tracker [BigBeluga]
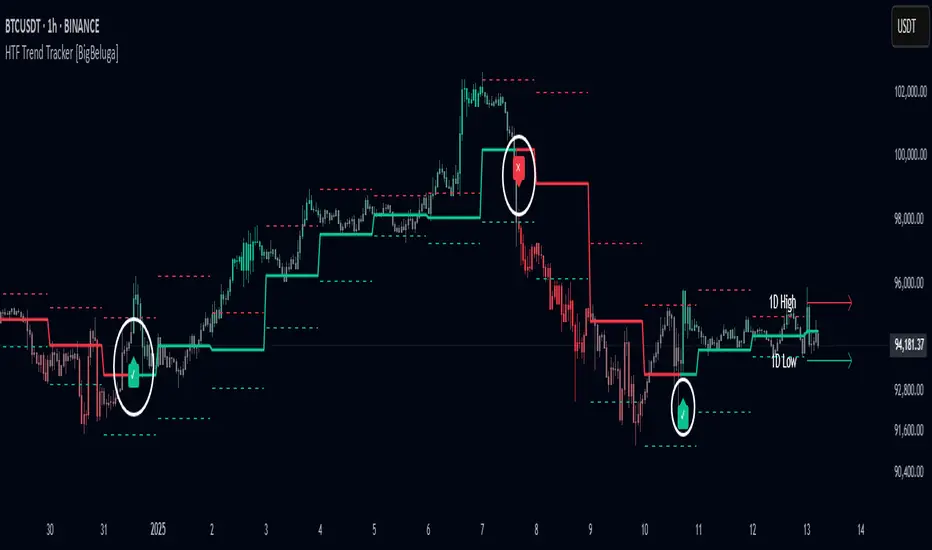
HTF Trend Tracker [BigBeluga] is a higher timeframe (HTF) trend tracking indicator designed to help traders identify significant trends, key levels, and market sentiment. The indicator dynamically adapts to the current price action, using HTF highs and lows to display trend direction and strength with detailed visuals.

🔵Key Features:
Dynamic Trend Detection:
Historical and Active HTF Levels:
🔵Key Features:
Dynamic Trend Detection:
- Uptrend is identified when the price closes above the HTF high.
- Downtrend is detected when the price closes below the HTF low.
- Midline changes color dynamically based on the trend direction:
- Bullish Green: Indicates an uptrend.
- Bearish Red: Indicates a downtrend.
Historical and Active HTF Levels:
- Historic HTF highs and lows are displayed as dotted lines.
- Current active HTF high and low levels are shown as solid lines.
- Timeframe labels (e.g., "1D High" or "1D Low") mark the active levels for clarity.
Trend Change Signals:
- A green checkmark (✓) is plotted when an uptrend starts.
- A red cross (✕) appears when a downtrend begins.
- Candle colors change dynamically based on the trend and the price's distance from the midline:
- Intense Bullish Green: Price is far above the midline during an uptrend.
- Intense Bearish Red: Price is far below the midline during a downtrend.
- Neutral Gray: Price is near the midline.
- Users can customize the colors to suit their preferences.
🔵Usage:- Identify uptrends and downtrends using the midline's color and the position of the close relative to the HTF levels.
- Use solid lines and timeframe labels to track current HTF high and low levels.
- Observe dotted lines for historical HTF levels to understand past price behavior.
- Watch for checkmark (✓) and cross (✕) signals to spot trend changes and key market shifts.
- Monitor candle colors to gauge trend intensity and proximity to the midline:
- Intense colors signal strong trends, while neutral gray indicates consolidation near the midline.
- A green checkmark (✓) is plotted when an uptrend starts.
오픈 소스 스크립트
트레이딩뷰의 진정한 정신에 따라, 이 스크립트의 작성자는 이를 오픈소스로 공개하여 트레이더들이 기능을 검토하고 검증할 수 있도록 했습니다. 작성자에게 찬사를 보냅니다! 이 코드는 무료로 사용할 수 있지만, 코드를 재게시하는 경우 하우스 룰이 적용된다는 점을 기억하세요.
🔵Gain access to our powerful tools : bigbeluga.com/tv
🔵Join our free discord for updates : bigbeluga.com/discord
All scripts & content provided by BigBeluga are for informational & educational purposes only.
🔵Join our free discord for updates : bigbeluga.com/discord
All scripts & content provided by BigBeluga are for informational & educational purposes only.
면책사항
해당 정보와 게시물은 금융, 투자, 트레이딩 또는 기타 유형의 조언이나 권장 사항으로 간주되지 않으며, 트레이딩뷰에서 제공하거나 보증하는 것이 아닙니다. 자세한 내용은 이용 약관을 참조하세요.