OPEN-SOURCE SCRIPT
업데이트됨 ChangeTrend [kingthies_]
% X Change Over Y Amount of Time
AKA "ChangeTrend"
Published by user Eric Thies [kingthies_] on 9/3/2020
Description
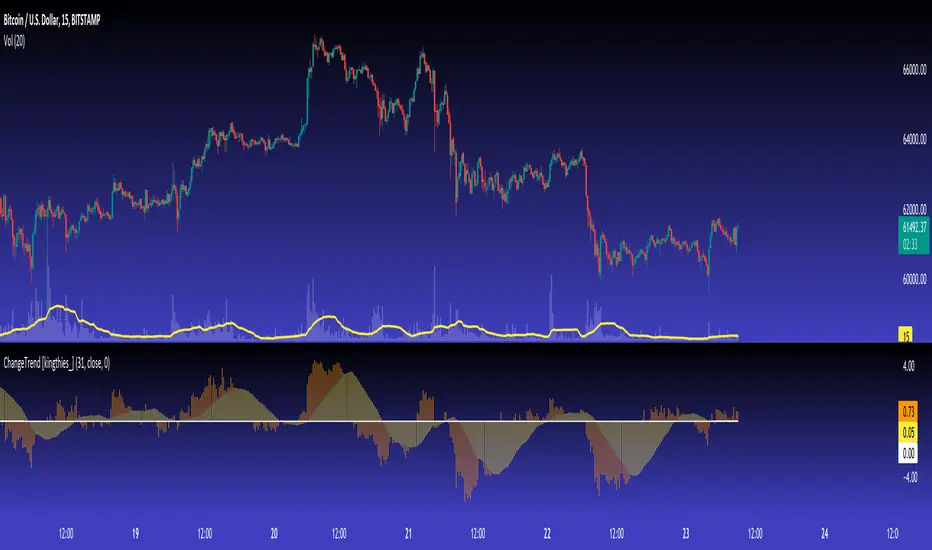
Relatively simple script that is measuring the performance of the input over the previous y # bars.
The EMA appears to make troughs and peaks easy to see coming / look at as they happen.
Interpretation:
Cheers,
AKA "ChangeTrend"
Published by user Eric Thies [kingthies_] on 9/3/2020
Description
Relatively simple script that is measuring the performance of the input over the previous y # bars.
The EMA appears to make troughs and peaks easy to see coming / look at as they happen.
Interpretation:
- Orange Histogram Represents the immediate % Change
- Yellow Histogram represents the overall trend of such as an SMA of the same Y # of bars.
Cheers,
릴리즈 노트
Upgraded to pine v5오픈 소스 스크립트
트레이딩뷰의 진정한 정신에 따라, 이 스크립트의 작성자는 이를 오픈소스로 공개하여 트레이더들이 기능을 검토하고 검증할 수 있도록 했습니다. 작성자에게 찬사를 보냅니다! 이 코드는 무료로 사용할 수 있지만, 코드를 재게시하는 경우 하우스 룰이 적용된다는 점을 기억하세요.
Eric Thies
면책사항
해당 정보와 게시물은 금융, 투자, 트레이딩 또는 기타 유형의 조언이나 권장 사항으로 간주되지 않으며, 트레이딩뷰에서 제공하거나 보증하는 것이 아닙니다. 자세한 내용은 이용 약관을 참조하세요.
오픈 소스 스크립트
트레이딩뷰의 진정한 정신에 따라, 이 스크립트의 작성자는 이를 오픈소스로 공개하여 트레이더들이 기능을 검토하고 검증할 수 있도록 했습니다. 작성자에게 찬사를 보냅니다! 이 코드는 무료로 사용할 수 있지만, 코드를 재게시하는 경우 하우스 룰이 적용된다는 점을 기억하세요.
Eric Thies
면책사항
해당 정보와 게시물은 금융, 투자, 트레이딩 또는 기타 유형의 조언이나 권장 사항으로 간주되지 않으며, 트레이딩뷰에서 제공하거나 보증하는 것이 아닙니다. 자세한 내용은 이용 약관을 참조하세요.