OPEN-SOURCE SCRIPT
Intraday Volume Indicator for INDICES by TBTPH
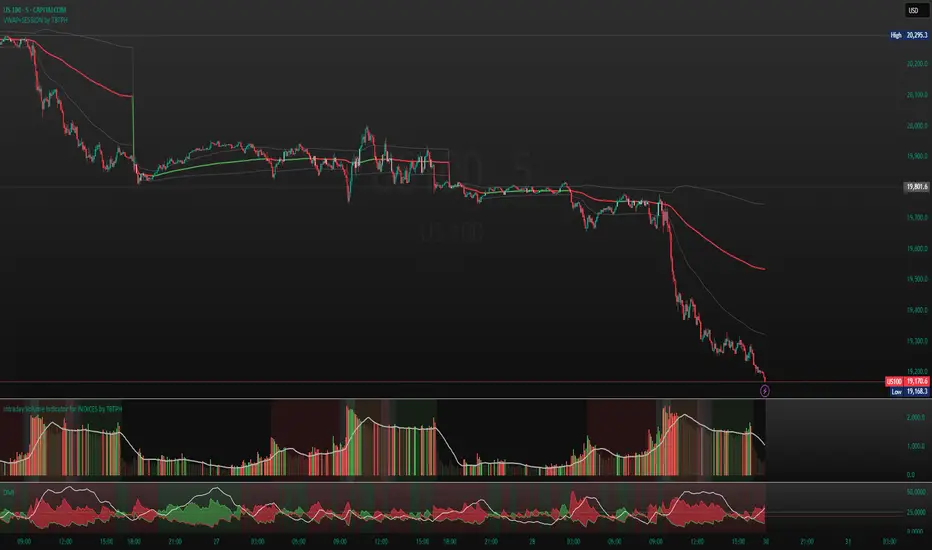
Pine Script code for an intraday volume indicator with session and lunch break highlights looks great! Here’s a summary of what each part of the script does:
Indicator Settings:
The indicator is set to show on a separate pane (overlay=false).
The SMA Length is adjustable with an input box (default of 20).
Volume and SMA Calculation:
You calculate the Simple Moving Average (SMA) of the volume over the selected length.
The volume color is determined based on whether the close price is higher or lower than the previous close and if the volume is above or below the SMA.
Volume Plot:
Volume is plotted as a histogram with different colors to indicate if the volume is higher or lower than the SMA.
You plot the SMA of the volume with an orange line for easier comparison.
Background Color:
You set a light gray background color to give a subtle contrast.
NYSE and LSE trading sessions are highlighted with green and blue, respectively.
Lunch break periods are highlighted with a white background for both exchanges.
Here are a couple of improvements or suggestions you might consider:
Session Time Overlap Handling:
If the script is applied to a chart where both NYSE and LSE data is visible, they may overlap depending on the time zone of your chart. Ensure the session times align with the active market's timezone, especially if you are using a chart with a different timezone setting.
Color Customization:
The color scheme for bullish/bearish volume could be enhanced further. For example, you could introduce more transparency for low-volume periods to make the histogram appear more subtle during less active trading times.
Handling Different Time Zones:
If your chart is not in the "America/New_York" or "GMT" time zone, be mindful of the session times. The timestamp function depends on the chart’s time zone, so ensuring you're adjusting for different markets is key.
오픈 소스 스크립트
트레이딩뷰의 진정한 정신에 따라, 이 스크립트의 작성자는 이를 오픈소스로 공개하여 트레이더들이 기능을 검토하고 검증할 수 있도록 했습니다. 작성자에게 찬사를 보냅니다! 이 코드는 무료로 사용할 수 있지만, 코드를 재게시하는 경우 하우스 룰이 적용된다는 점을 기억하세요.
면책사항
해당 정보와 게시물은 금융, 투자, 트레이딩 또는 기타 유형의 조언이나 권장 사항으로 간주되지 않으며, 트레이딩뷰에서 제공하거나 보증하는 것이 아닙니다. 자세한 내용은 이용 약관을 참조하세요.
오픈 소스 스크립트
트레이딩뷰의 진정한 정신에 따라, 이 스크립트의 작성자는 이를 오픈소스로 공개하여 트레이더들이 기능을 검토하고 검증할 수 있도록 했습니다. 작성자에게 찬사를 보냅니다! 이 코드는 무료로 사용할 수 있지만, 코드를 재게시하는 경우 하우스 룰이 적용된다는 점을 기억하세요.
면책사항
해당 정보와 게시물은 금융, 투자, 트레이딩 또는 기타 유형의 조언이나 권장 사항으로 간주되지 않으며, 트레이딩뷰에서 제공하거나 보증하는 것이 아닙니다. 자세한 내용은 이용 약관을 참조하세요.