INVITE-ONLY SCRIPT
WMTSTRATEGY - SMC and EMA
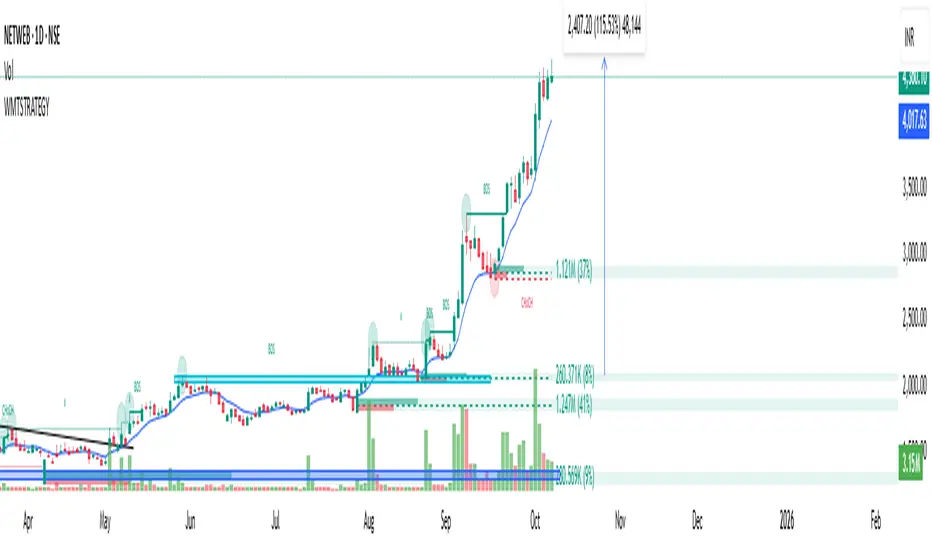
9 EMA: An indicator for short-term momentum
The 9-period Exponential Moving Average (EMA) is a line on a price chart that tracks the average price over the last nine periods, giving more weight to the most recent data. This makes it more responsive to new price changes than a Simple Moving Average (SMA), which weights all periods equally.
How it's used:
Identifies short-term trends: When the price stays consistently above the 9 EMA, it suggests an uptrend. When it stays below, it suggests a downtrend.
Provides dynamic support and resistance: In an uptrend, the price often bounces off the 9 EMA, which acts as a support level. In a downtrend, it acts as resistance.
Generates buy and sell signals: Traders may use price crossing above the 9 EMA as a potential buy signal, and crossing below as a potential sell signal.
SMC: A methodology for institutional analysis
Smart Money Concepts (SMC) is a price action-based trading methodology focused on identifying where institutional "smart money" is entering and exiting the market. It relies on concepts like market structure, order blocks, liquidity grabs, and imbalances to predict market direction, in contrast to traditional retail trading methods.
Key concepts within SMC:
Order Blocks: These are specific candle formations that signify institutional accumulation or distribution and are considered high-probability reversal or continuation zones.
Liquidity Grabs (or Sweeps): The process where institutional traders push the price past a clear high or low to trigger retail traders' stop-loss orders and enter their own positions in the opposite direction.
Market Structure: Analyzing the sequence of higher highs/higher lows (for an uptrend) or lower lows/lower highs (for a downtrend) to determine the overall market direction.
The synergy of 9 EMA and SMC
By combining the 9 EMA with SMC, traders can filter out low-quality signals and improve the precision of their entries and exits.
Strategy example:
Identify the SMC zone: Use SMC analysis to identify a high-probability demand zone (for a long trade) or supply zone (for a short trade). This zone acts as your area of interest for a potential entry.
Wait for price to enter the zone: Wait for the price to retrace into your identified SMC zone.
Confirm the signal with the 9 EMA: On a lower timeframe, wait for the price to cross and close above the 9 EMA (in a demand zone) or below the 9 EMA (in a supply zone). This cross serves as a precise entry trigger, confirming that short-term momentum is shifting in your favor within the high-probability institutional zone.
How this combination adds value:
Filters false signals: SMC helps avoid trading every 9 EMA crossover by only focusing on those that occur within a high-probability institutional zone.
Improves timing: The 9 EMA provides a sensitive entry trigger, preventing premature entries and getting you into a trade as momentum confirms the SMC-identified area of interest.
Boosts confidence: Entering a trade where both institutional footprints (SMC) and short-term momentum (9 EMA) align provides a higher-conviction setup.
초대 전용 스크립트
이 스크립트는 작성자가 승인한 사용자만 접근할 수 있습니다. 사용하려면 요청을 보내고 승인을 받아야 합니다. 일반적으로 결제 후에 승인이 이루어집니다. 자세한 내용은 아래 작성자의 지침을 따르거나 worldmosttrader에게 직접 문의하세요.
트레이딩뷰는 스크립트 작성자를 완전히 신뢰하고 스크립트 작동 방식을 이해하지 않는 한 스크립트 비용을 지불하거나 사용하지 않는 것을 권장하지 않습니다. 무료 오픈소스 대체 스크립트는 커뮤니티 스크립트에서 찾을 수 있습니다.
작성자 지시 사항
9 EMA: An indicator for short-term momentum
The 9-period Exponential Moving Average (EMA) is a line on a price chart that tracks the average price over the last nine periods, giving more weight to the most recent data. This makes it more responsive to new
면책사항
이 정보와 게시물은 TradingView에서 제공하거나 보증하는 금융, 투자, 거래 또는 기타 유형의 조언이나 권고 사항을 의미하거나 구성하지 않습니다. 자세한 내용은 이용 약관을 참고하세요.