OPEN-SOURCE SCRIPT
Cryptogenik's Inflation-Adjusted Candles v2025
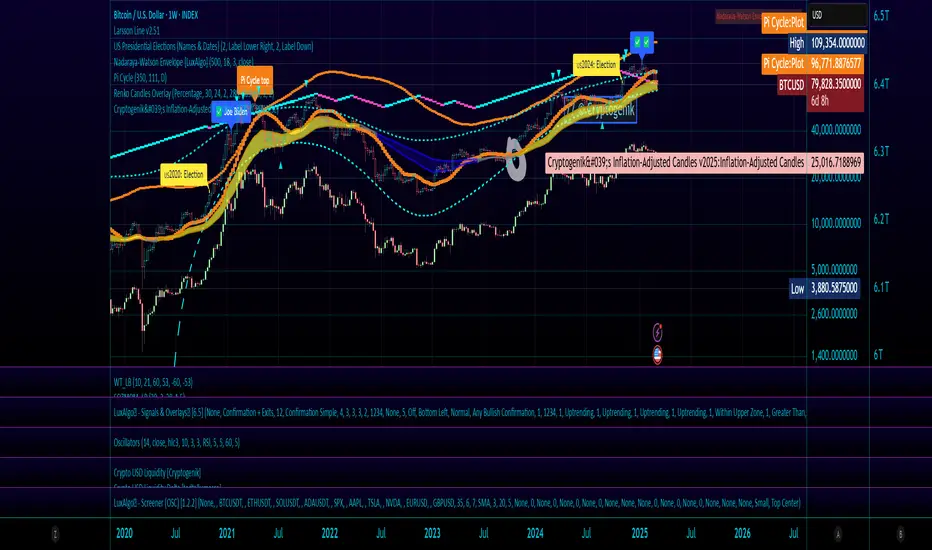
Inflation-Adjusted Price Indicator by Cryptogenik
This indicator adjusts price data for inflation, allowing you to visualize how stock/asset prices would look with constant purchasing power. By using Consumer Price Index (CPI) data from FRED, it transforms nominal prices into inflation-adjusted values that reflect real-world purchasing power.
What This Indicator Does
The Inflation-Adjusted Price indicator converts traditional price charts to show what prices would be if the purchasing power of currency remained constant. This is essential for long-term analysis, as it removes the distortion caused by inflation when comparing prices across different time periods.
Key Features
How To Use It
This indicator is particularly valuable for analyzing stocks, commodities, and other assets over periods of 5+ years, where inflation effects become significant. It helps answer the question: "Has this asset truly increased in value, or is the price increase just reflecting inflation?"
Technical Details
The indicator calculates adjusted prices using the formula: (price / CPI) * 100, which effectively shows prices as a percentage of current purchasing power. This approach normalizes all prices to a consistent standard, making historical comparisons more meaningful.
Cryptogenik's Inflation-Adjusted Candles v2025
This indicator adjusts price data for inflation, allowing you to visualize how stock/asset prices would look with constant purchasing power. By using Consumer Price Index (CPI) data from FRED, it transforms nominal prices into inflation-adjusted values that reflect real-world purchasing power.
What This Indicator Does
The Inflation-Adjusted Price indicator converts traditional price charts to show what prices would be if the purchasing power of currency remained constant. This is essential for long-term analysis, as it removes the distortion caused by inflation when comparing prices across different time periods.
Key Features
- Displays inflation-adjusted price candles alongside original prices
- Uses official CPI data from the Federal Reserve (FRED:CPIAUCSL)
- Allows easy comparison between nominal and real prices
- Helps identify true price movements by filtering out the effects of inflation
- Perfect for long-term investors and macroeconomic analysis
How To Use It
- Apply the indicator to any chart
- Green/red candles show the inflation-adjusted prices
- Gray line shows the original unadjusted price
- The information label displays the current CPI value
This indicator is particularly valuable for analyzing stocks, commodities, and other assets over periods of 5+ years, where inflation effects become significant. It helps answer the question: "Has this asset truly increased in value, or is the price increase just reflecting inflation?"
Technical Details
The indicator calculates adjusted prices using the formula: (price / CPI) * 100, which effectively shows prices as a percentage of current purchasing power. This approach normalizes all prices to a consistent standard, making historical comparisons more meaningful.
Cryptogenik's Inflation-Adjusted Candles v2025
오픈 소스 스크립트
트레이딩뷰의 진정한 정신에 따라, 이 스크립트의 작성자는 이를 오픈소스로 공개하여 트레이더들이 기능을 검토하고 검증할 수 있도록 했습니다. 작성자에게 찬사를 보냅니다! 이 코드는 무료로 사용할 수 있지만, 코드를 재게시하는 경우 하우스 룰이 적용된다는 점을 기억하세요.
면책사항
해당 정보와 게시물은 금융, 투자, 트레이딩 또는 기타 유형의 조언이나 권장 사항으로 간주되지 않으며, 트레이딩뷰에서 제공하거나 보증하는 것이 아닙니다. 자세한 내용은 이용 약관을 참조하세요.
오픈 소스 스크립트
트레이딩뷰의 진정한 정신에 따라, 이 스크립트의 작성자는 이를 오픈소스로 공개하여 트레이더들이 기능을 검토하고 검증할 수 있도록 했습니다. 작성자에게 찬사를 보냅니다! 이 코드는 무료로 사용할 수 있지만, 코드를 재게시하는 경우 하우스 룰이 적용된다는 점을 기억하세요.
면책사항
해당 정보와 게시물은 금융, 투자, 트레이딩 또는 기타 유형의 조언이나 권장 사항으로 간주되지 않으며, 트레이딩뷰에서 제공하거나 보증하는 것이 아닙니다. 자세한 내용은 이용 약관을 참조하세요.