INVITE-ONLY SCRIPT
Renko Ghost, v. 2.0
Renko Ghost
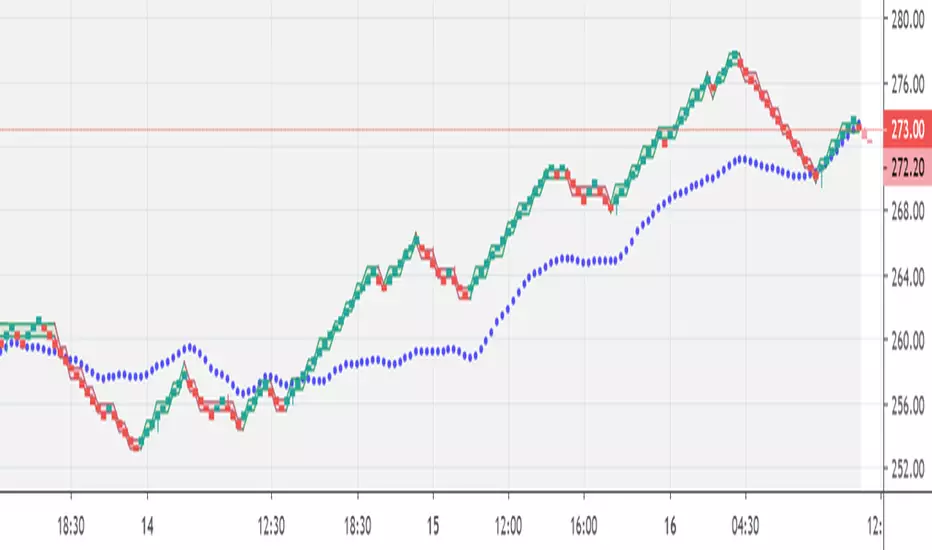
Custom-designed to take advantage of the smoothing signals from Renko charting, Renko Ghost creates client-side ATR calculations to build an overlay of “ghost” Renko blocks which emulate the popular ATR blocks on top of TradingView’s Traditional Renko charts. By combining constant ATR updates with the “trend anticipation” patterning of our other systems, Renko Ghost can deliver more responsive, finely-tuned reads on market turns. (Check out results below) Contact us for a free trial to test Renko Ghost on your go-to charts. And be sure to check out our other dynamic trading systems.
We are always available for questions, comments, and suggestions. There is always room for improvement.
Results Chart
The backtests below show 1-year returns against a Buy and Hold (B+H) approach for 40 of the world’s top traded instruments (as measured by price volume or similar indicator). The Renko Ghost system was run on the top 10 instruments in four major markets: Equities, ETFs, Cryptocurrencies, and Forex. All tests were on a 30min chart, set to Renko “Traditional” blocks (because TradingView does not support realtime alerts from ATR-based charts). Block size was set proportionately to price to give the instrument positive results, but there was no “cherry-picking”. (In fact, changing time frames would have produced even better returns in some cases, but it seemed best to use a consistent measure.) Subscribers to the system receive a full, step-by-step breakdown on how to customize the parameters to get the best from their favorite markets.
(For each instrument, you see listed its Symbol (name), Profit % (annual return using Renko Ghost), Winning Trade % (being “right”), ProfitFactor (Ratio of money won to money lost), Max Draw Down % (point of worst % loss during the year), and B+H (how much the asset would have returned with no trades, via "buy-and-hold" )...)
Renko Ghost
Settings: 30 min, Traditional Renko box, over 1 year (June 1, 2018 - June 1, 2019)
EQUITIES
Symbol,_.,_.Profit %,_.Trade %,_.Pf,_.Max Dr Dn,_.B + H
AMZN,_.,_.,_.1,874,_.,_.62,_.,_.6.3,_.,_.3,_.,_.,_.,_.7
AAPL,_.,_.,_.,_.141,_.,_.48,_.,_.3.4,_.,_.5,_.,_.,_.,_.5
TSLA,_.,_.,_._6,603,_.,_.58,_.,_.5.6,_.,_.6,_.,_.,_.(-38)
FB,_.,_.,_.,_.,_.170,_.,_.48,_.,_.3,_.,_.,_8,_.,_.,_.(-7)
BABA,_.,_.,_.,_.220,_.,_.56,_.,_.3.2,_.,_.9,_.,_.,_.(-23)
BYND,_.,_.,_.,_.305,_.,_.60,_.,_.7.1,_.,_.5,_.,_.,_,_140
MSFT,_.,_.,_.,_.191,_.,_.57,_.,_.6,_.,_.,_3,_.,_.,_.,,_28
AMD,_.,_.,_.,_.,142,_.,_.45,_.,_.2.3,_.,_13,_.,_.,_.,_,0
NFLX_,_.,_.,_.1,902,_.,_.54,_.,_.1.4,_.,_11,_.,_.,_.,(-5)
BA,_.,_.,_.,_.,_.560,_.,_.54,_.,_.4.9,_.,_.3,_.,_.,_.,,_97
ETFs
Symbol,_.Profit %,_.Trade %,_.Pf,_.Max DrDn,_.B + H
SPY,_.,_.,_.724,_.,_.64,_.,_.,_8.3,_.,_.1,_.,_.,_.4
QQQ,_.,_.2,553,_.,_.63,_.,_.,_9.3,_.,_.1,_.,_.,_.5
EEM,_.,_.,_.340,_.,_.52,_.,_.,_5.5,_.,_.2,_.,_.,_.0
IWM,_.,_.,1,801,_.,_.61,_.,_.,_7.7,_.,_.1,_.,_.,(-3)
HYG,_.,_.,_.,17,_.,_.45,_.,_.,_2.5,_.,_.1,_.,_.,,0.5
EWZ,_.,_.4,855,_.,_.59,_.,_.,_9.2,_.,_.2,_.,_.,_.26
LQD,_.,_.,_.,12,_.,_.48,_.,_.,_1.7,_.,_.2,_.,_.,_.6
EFA,_.,_.,_.192,_.,_.52,_.,_.,_4.9,_.,_.2,_.,_.,_(-7)
FXI,_.,_.,_.669,_.,_.55,_.,_.,_6.3,_.,_.,1,_.,_.,(-15)
XLF,_.,_.,_.287,_.,_.55,_.,_.,_4.8,_.,_.,2,_.,_.,(-3)
CRYPTOCURRENCIES
Symbol,_.,_.Profit %,_.Trade %,_.Pf,_.Max DrDn,_.B + H
BTC/USD,_.22 million,_.,_.54,_.,8.1,_.,_3,_.,_.,_.(-8)
ETH/USD,_.15 million,_.,_.50,_.,5.1,_.,_7,_.,_.,_(-54)
XRP/USD,_.26 million,_.,_.49,_.,4.3,_.,_8,_.,_.,_(-21)
LTC/USD,_.785,000,_.,_.,_50,_.,5,_.,_.,12,_.,_.,_.13
BCH/USD,_.756,000,_.,_.,_46,_.,3.6,_.,15,_.,_.,_.(-5)
EOS/USD,_.258,000,_.,_.,_47,_.,3.5,_.,,27,_.,_.,_.13
BNB/USDT,_22 million,_.,_55,_.,7.3,_.,_.8,_.,_.,_143
BSV/USD,_.170,000,_.,_.,_64,.100,_.,_.,,4,_.,_.,_(-8)
XLM/USD,_.15 billion,_.,_.61,_.,7.7,_.,_.5,_.,_.,_.34
ADA/USD,_.136,000,_.,_.,70,_.20,_.,_.,_.2,_.,_.,_.3
FOREX PAIRS
Symbol,_.,_.Profit %,_.Trade %,_.Pf,_.Max Dr Dn,_.B + H
EUR/USD,_.,_.13,_.,_.,_36,_.,_.,1.5,_.,_.,_2,_.,_.,_(-4)
USD/JPY,_.,_.,,5,_.,_.,_31,_.,_.,1.2,_.,_.,_2,_.,_.,_(-1)
AUD/USD,_.,_.26,_.,_.,_44,_.,_.,2,_.,_.,_.,3,_.,_.,_.10
USD/CAD,_.,_.16,_.,_.,_37,_.,_.,1.6,_.,_.,_2,_.,_.,_.,3
GBP/USD,_.,_.37,_.,_.,_37,_.,_.,1.7,_.,_.,_2,_.,_.,_(-5)
NZD/USD,_.,_.24,_.,_.,_50,_.,_.,2,_.,_.,_.,2,_.,_.,_(-6)
GBP/JPY,_.,_.57,_.,_.,_41,_.,_.,1.8,_.,_.,_3,_.,_.,_(-6)
EUR/JPY,_.,_.19,_.,_.,_39,_.,_.,1.4,_.,_.,_4,_.,_.,_(-5)
AUD/JPY,_.,_.50,_.,_.,_36,_.,_.,1.7,_.,_.,_4,_.,_.,(-10)
EUR/GBP,_.,_.13,_.,_.,_41,_.,_.,1.4,_.,_.,_3,_.,_.,_0.1
초대 전용 스크립트
이 스크립트는 작성자가 승인한 사용자만 접근할 수 있습니다. 사용하려면 요청 후 승인을 받아야 하며, 일반적으로 결제 후에 허가가 부여됩니다. 자세한 내용은 아래 작성자의 안내를 따르거나 vogoninvictus에게 직접 문의하세요.
트레이딩뷰는 스크립트의 작동 방식을 충분히 이해하고 작성자를 완전히 신뢰하지 않는 이상, 해당 스크립트에 비용을 지불하거나 사용하는 것을 권장하지 않습니다. 커뮤니티 스크립트에서 무료 오픈소스 대안을 찾아보실 수도 있습니다.
작성자 지시 사항
면책사항
해당 정보와 게시물은 금융, 투자, 트레이딩 또는 기타 유형의 조언이나 권장 사항으로 간주되지 않으며, 트레이딩뷰에서 제공하거나 보증하는 것이 아닙니다. 자세한 내용은 이용 약관을 참조하세요.