PINE LIBRARY
업데이트됨 arraybrowser
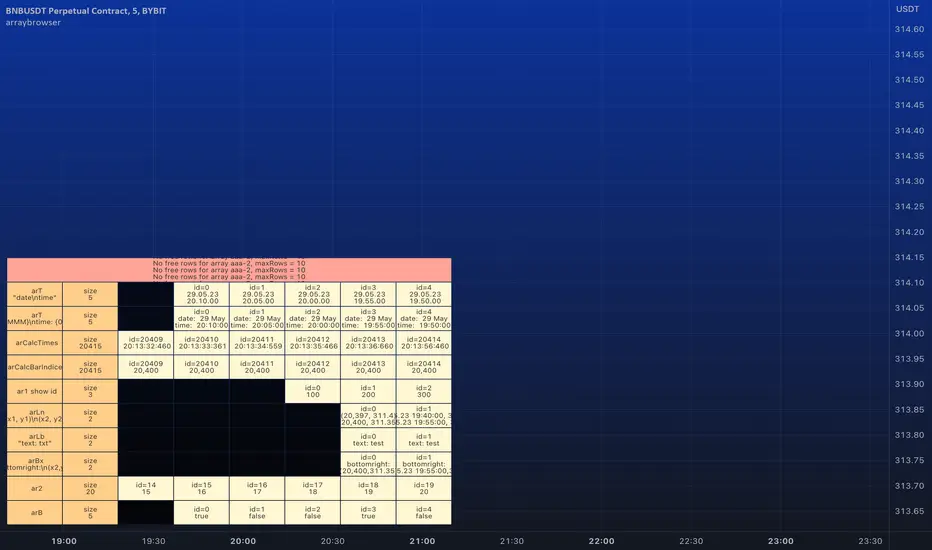
█ ARRAY BROWSER
Add you arrays to the array browser window and scroll them away left and right.
Flexible formatting options (see below).
Many thanks to kaigouthro for his beautiful matrixautotable library. (import kaigouthro/matrixautotable/14)
How to use
Copy the "ARRAY BROWSER" commented code section below to your script and uncomment.
See DEMO section in the library for usage examples.
Basically: add() your arrays and draw() on barstate.islast.
If your script adds the arrays every calculation do not forget to clear() before adding.
Otherwise, since the arrays are added by reference, no need to add them on every bar, every time you draw() the actual values are retrieved.
Up to 10 arrays of each type (float/string/line/label/box) are supported (total 50 arrays).
Change offset in the input settings to scroll left/right.
Usage example:
Pine Script®
Formatting options
For float/int you can always use format string like "{0, time, HH:mm:ss}" or "{0.00}".
Additional options are
- --- Number formats ---
- "number"
- "0"
- "0.0"
- "0.00"
- "0.000"
- "0.0000"
- "0.00000"
- "0.000000"
- "0.0000000"
- --- Date formats ---
- "date"
- "date : time"
- "dd.MM"
- "dd"
- --- Time formats ---
- "time"
- "HH:mm"
- "mm:ss"
- "date time"
- "date, time"
- "date,time"
- "date\time"
For line and box: Empty `format` returns coordinates as "(x1, y1) - (x2, y2)". Otherwise "x1", "x2", "y1", "y2" in `format` string are replaced by values. (e.g. toS(line, "x1, x2") will only return x1 and x2 separated by comma).
For label: Empty `format` returns coordinates and text as "(x, y): text = text". Otherwise "x1", "y1", "txt" in `format` string are replaced by values. (e.g. toS(label, "txt") will only return text of the label)
Add you arrays to the array browser window and scroll them away left and right.
Flexible formatting options (see below).
Many thanks to kaigouthro for his beautiful matrixautotable library. (import kaigouthro/matrixautotable/14)
How to use
Copy the "ARRAY BROWSER" commented code section below to your script and uncomment.
See DEMO section in the library for usage examples.
Basically: add() your arrays and draw() on barstate.islast.
If your script adds the arrays every calculation do not forget to clear() before adding.
Otherwise, since the arrays are added by reference, no need to add them on every bar, every time you draw() the actual values are retrieved.
Up to 10 arrays of each type (float/string/line/label/box) are supported (total 50 arrays).
Change offset in the input settings to scroll left/right.
Usage example:
import moebius1977/arraybrowser/1 as arraybrowser // this alias is used in the copied section, so better keep it
[...]
<COPIED "ARRAY BROWSER" SECTION>
[...]
arbr.clear() // clears all rows and deletes the table
arbr.add(arrayFloat, format = "0.00") // adds an array with title
arbr.add(arrayInt) // adds an array without title
arbr.add(arrayTimes, "array of times 1", "date\ntime") // format date and time so as to fit in the cell.
arbr.add(arrayTimes, "array of times 2", "{0, time, HH:mm}") // format date and time so as to fit in the cell.
arbr.add(arrayString) //
arbr.add(arrayLine, "arrayLines", "(x1, y1)\n(x2,y2)") // use your own format combining "x1", "y1", "x2", "y2"
arbr.add(arrayLabel, "arrayLabel", "txt") // only print label text, no coordinates
arbr.add(arrayBox, showIds = true) // show ID's for this array if input setting is "individually"
arbr.draw() // shows the table with arrays, use on barstate.islast
Formatting options
For float/int you can always use format string like "{0, time, HH:mm:ss}" or "{0.00}".
Additional options are
- --- Number formats ---
- "number"
- "0"
- "0.0"
- "0.00"
- "0.000"
- "0.0000"
- "0.00000"
- "0.000000"
- "0.0000000"
- --- Date formats ---
- "date"
- "date : time"
- "dd.MM"
- "dd"
- --- Time formats ---
- "time"
- "HH:mm"
- "mm:ss"
- "date time"
- "date, time"
- "date,time"
- "date\time"
For line and box: Empty `format` returns coordinates as "(x1, y1) - (x2, y2)". Otherwise "x1", "x2", "y1", "y2" in `format` string are replaced by values. (e.g. toS(line, "x1, x2") will only return x1 and x2 separated by comma).
For label: Empty `format` returns coordinates and text as "(x, y): text = text". Otherwise "x1", "y1", "txt" in `format` string are replaced by values. (e.g. toS(label, "txt") will only return text of the label)
릴리즈 노트
v2 Added support for bool arrays. Changing text color does not work temporarily.
릴리즈 노트
v3 A minor bug fix. (in deleteRow())릴리즈 노트
v4 Same amendment as above.릴리즈 노트
v5 Added support for varip arrays. Previous versions disrupted behaviour of varip arrays.파인 라이브러리
트레이딩뷰의 진정한 정신에 따라, 작성자는 이 파인 코드를 오픈소스 라이브러리로 게시하여 커뮤니티의 다른 파인 프로그래머들이 재사용할 수 있도록 했습니다. 작성자에게 경의를 표합니다! 이 라이브러리는 개인적으로 사용하거나 다른 오픈소스 게시물에서 사용할 수 있지만, 이 코드의 게시물 내 재사용은 하우스 룰에 따라 규제됩니다.
면책사항
해당 정보와 게시물은 금융, 투자, 트레이딩 또는 기타 유형의 조언이나 권장 사항으로 간주되지 않으며, 트레이딩뷰에서 제공하거나 보증하는 것이 아닙니다. 자세한 내용은 이용 약관을 참조하세요.
파인 라이브러리
트레이딩뷰의 진정한 정신에 따라, 작성자는 이 파인 코드를 오픈소스 라이브러리로 게시하여 커뮤니티의 다른 파인 프로그래머들이 재사용할 수 있도록 했습니다. 작성자에게 경의를 표합니다! 이 라이브러리는 개인적으로 사용하거나 다른 오픈소스 게시물에서 사용할 수 있지만, 이 코드의 게시물 내 재사용은 하우스 룰에 따라 규제됩니다.
면책사항
해당 정보와 게시물은 금융, 투자, 트레이딩 또는 기타 유형의 조언이나 권장 사항으로 간주되지 않으며, 트레이딩뷰에서 제공하거나 보증하는 것이 아닙니다. 자세한 내용은 이용 약관을 참조하세요.