OPEN-SOURCE SCRIPT
업데이트됨 Simple Auto Swing Lines
# Simple Auto Swing Lines
## What It Does
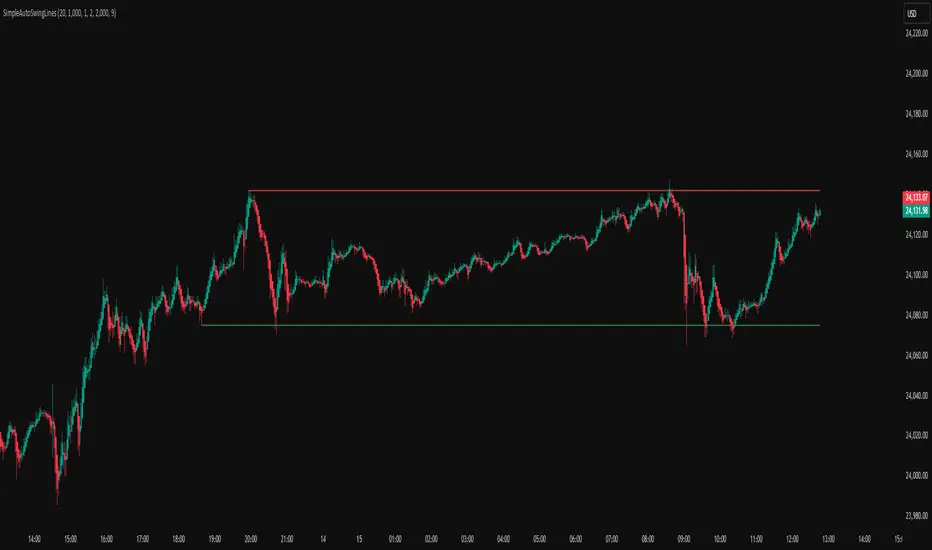
This indicator automatically draws horizontal support and resistance lines based on swing highs and lows with line management and touch-based alerts.
## How It Works
**Swing Detection:**
- Uses pivot point analysis to identify significant highs and lows
- Configurable pivot strength determines sensitivity (higher = more significant swings)
- Draws horizontal lines from these swing points extending to current price
**Line Management:**
- Proximity Filter: Removes lines that are too close together to prevent clutter
- Auto-Hide Feature: Lines disappear after price closes beyond them for a set number of candles
- Permanent Clipping: Once a line is crossed for the threshold period, it stays hidden
- Dynamic Updates: Only shows the most relevant recent swing levels
**Touch-Based Alert System:**
- "Swing High touched" - Alerts when price touches resistance lines from any direction
- "Swing Low touched" - Alerts when price touches support lines from any direction
- "Any Swing Level touched" - Combined alert for any swing line interaction
## Key Settings
**Pivot Detection:**
- Pivot Strength (50): Higher values = fewer, more significant swing lines
- Max Lookback Bars (1000): How far back to look for swing points
**Line Appearance:**
- Max Lines (5): Maximum number of swing lines per side (total lines = 2x this number)
- Line Thickness (1-5): Customize line width
- Resistance/Support Colors: Red for highs, green for lows
- Show Labels: Optional swing high/low labels (default: off)
**Display Controls:**
- Proximity Filter (2000 ticks): Minimum distance between lines to prevent clutter
- Candles Before Hide (7): How many consecutive closes beyond a line before permanent removal
## What It Does
This indicator automatically draws horizontal support and resistance lines based on swing highs and lows with line management and touch-based alerts.
## How It Works
**Swing Detection:**
- Uses pivot point analysis to identify significant highs and lows
- Configurable pivot strength determines sensitivity (higher = more significant swings)
- Draws horizontal lines from these swing points extending to current price
**Line Management:**
- Proximity Filter: Removes lines that are too close together to prevent clutter
- Auto-Hide Feature: Lines disappear after price closes beyond them for a set number of candles
- Permanent Clipping: Once a line is crossed for the threshold period, it stays hidden
- Dynamic Updates: Only shows the most relevant recent swing levels
**Touch-Based Alert System:**
- "Swing High touched" - Alerts when price touches resistance lines from any direction
- "Swing Low touched" - Alerts when price touches support lines from any direction
- "Any Swing Level touched" - Combined alert for any swing line interaction
## Key Settings
**Pivot Detection:**
- Pivot Strength (50): Higher values = fewer, more significant swing lines
- Max Lookback Bars (1000): How far back to look for swing points
**Line Appearance:**
- Max Lines (5): Maximum number of swing lines per side (total lines = 2x this number)
- Line Thickness (1-5): Customize line width
- Resistance/Support Colors: Red for highs, green for lows
- Show Labels: Optional swing high/low labels (default: off)
**Display Controls:**
- Proximity Filter (2000 ticks): Minimum distance between lines to prevent clutter
- Candles Before Hide (7): How many consecutive closes beyond a line before permanent removal
릴리즈 노트
Updated chart example to include both support and resistance lines. 릴리즈 노트
Fix: sometimes alerts were going off when swing level wasn't touched. This should not happen anymore. 릴리즈 노트
Add: 'Extend Left' and 'Extend Right' settings for displayed lines 오픈 소스 스크립트
트레이딩뷰의 진정한 정신에 따라, 이 스크립트의 작성자는 이를 오픈소스로 공개하여 트레이더들이 기능을 검토하고 검증할 수 있도록 했습니다. 작성자에게 찬사를 보냅니다! 이 코드는 무료로 사용할 수 있지만, 코드를 재게시하는 경우 하우스 룰이 적용된다는 점을 기억하세요.
면책사항
해당 정보와 게시물은 금융, 투자, 트레이딩 또는 기타 유형의 조언이나 권장 사항으로 간주되지 않으며, 트레이딩뷰에서 제공하거나 보증하는 것이 아닙니다. 자세한 내용은 이용 약관을 참조하세요.
오픈 소스 스크립트
트레이딩뷰의 진정한 정신에 따라, 이 스크립트의 작성자는 이를 오픈소스로 공개하여 트레이더들이 기능을 검토하고 검증할 수 있도록 했습니다. 작성자에게 찬사를 보냅니다! 이 코드는 무료로 사용할 수 있지만, 코드를 재게시하는 경우 하우스 룰이 적용된다는 점을 기억하세요.
면책사항
해당 정보와 게시물은 금융, 투자, 트레이딩 또는 기타 유형의 조언이나 권장 사항으로 간주되지 않으며, 트레이딩뷰에서 제공하거나 보증하는 것이 아닙니다. 자세한 내용은 이용 약관을 참조하세요.