PROTECTED SOURCE SCRIPT
BTC Spot/Perp Price Delta
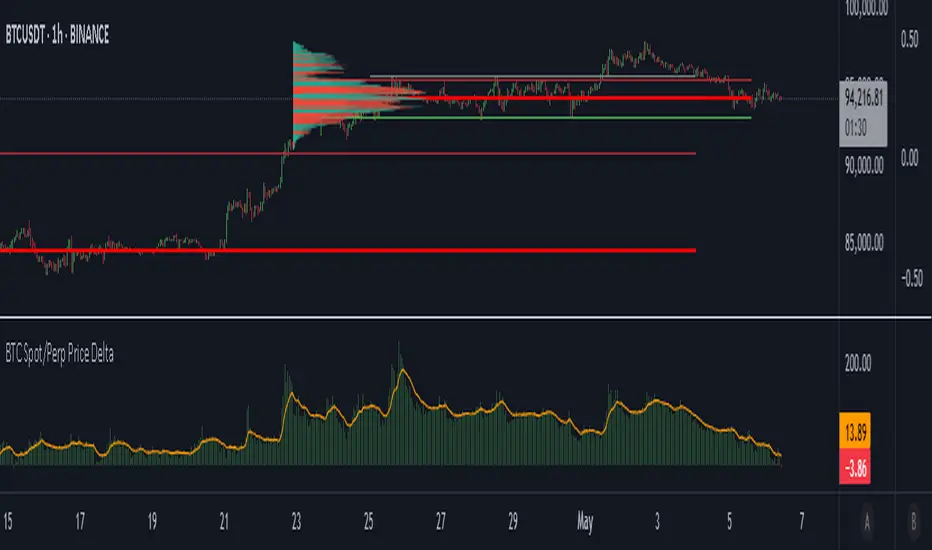
The indicator gathers price from 3 btc spot pairs (largest by volume) and 3 btc perp pairs (also largest by volume).
The average Spot and Perp prices are then derived.
The indicator plots the price difference between the Spot average and the Perps average (Spot minus Perps).
Green plot above the zero line means Spot price is higher than the Perp price at a candle close - Contango.
Red plot below the zero line means Spot Price is lower than the Perp price at a candle close - Backwardation.
The orange line is the EMA. Default value is 100 periods. Changeable by User.
Use cases:
1. Perp market is way larger than the Spot market, measured by traded Volume. We may say that the Perps market is more "stable", because it is more liquid. When Spot price deviates a lot from the Perps price, in both positive and negative directions, we may expect a mean reversion.
High Green or Red indicator values = expect price reversion.
2. Helps to observe absorption. If the indicator values are high (in both directions), but the price is barely moving, we can come to a conclusion that the opposite side Limit orders are being deployed to absorb Spot market orders.
Typically, this also indicates mean reversion.
3. You are welcome to use the indicator and perhaps find your own use cases.
Any suggestions on how to improve this indicator are welcome.
보호된 스크립트입니다
이 스크립트는 비공개 소스로 게시됩니다. 하지만 이를 자유롭게 제한 없이 사용할 수 있습니다 – 자세한 내용은 여기에서 확인하세요.
면책사항
해당 정보와 게시물은 금융, 투자, 트레이딩 또는 기타 유형의 조언이나 권장 사항으로 간주되지 않으며, 트레이딩뷰에서 제공하거나 보증하는 것이 아닙니다. 자세한 내용은 이용 약관을 참조하세요.
보호된 스크립트입니다
이 스크립트는 비공개 소스로 게시됩니다. 하지만 이를 자유롭게 제한 없이 사용할 수 있습니다 – 자세한 내용은 여기에서 확인하세요.
면책사항
해당 정보와 게시물은 금융, 투자, 트레이딩 또는 기타 유형의 조언이나 권장 사항으로 간주되지 않으며, 트레이딩뷰에서 제공하거나 보증하는 것이 아닙니다. 자세한 내용은 이용 약관을 참조하세요.