OPEN-SOURCE SCRIPT
Normalized Jurik Moving Average [QuantAlgo]
Upgrade your investing and trading strategy with the Normalized Jurik Moving Average (JMA), a sophisticated oscillator that combines adaptive smoothing with statistical normalization to deliver high-quality signals! Whether you're a swing trader looking for momentum shifts or a medium- to long-term investor focusing on trend validation, this indicator's statistical approach offers valuable analytical advantages that can enhance your trading and investing decisions!
🟢 Core Architecture
The foundation of this indicator lies in its unique dual-layer calculation system. The first layer implements the Jurik Moving Average, known for its superior noise reduction and responsiveness, while the second layer applies statistical normalization (Z-Score) to create standardized readings. This sophisticated approach helps identify significant price movements while filtering out market noise across various timeframes and instruments.

🟢 Technical Foundation
Three key components power this indicator are:

🟢 Key Features & Signals
The Normalized JMA delivers market insights through:

🟢 Practical Usage Tips
Here's how to maximize your use of the Normalized JMA:
1/ Setup:
2/ Reading Signals:
🟢 Pro Tips
🟢 Core Architecture
The foundation of this indicator lies in its unique dual-layer calculation system. The first layer implements the Jurik Moving Average, known for its superior noise reduction and responsiveness, while the second layer applies statistical normalization (Z-Score) to create standardized readings. This sophisticated approach helps identify significant price movements while filtering out market noise across various timeframes and instruments.
🟢 Technical Foundation
Three key components power this indicator are:
- Jurik Moving Average (JMA): An advanced moving average calculation that provides superior smoothing with minimal lag
- Statistical Normalization: Z-Score based scaling that creates consistent, comparable readings across different market conditions
- Dynamic Zone Detection: Automatically identifies overbought and oversold conditions based on statistical deviations
🟢 Key Features & Signals
The Normalized JMA delivers market insights through:
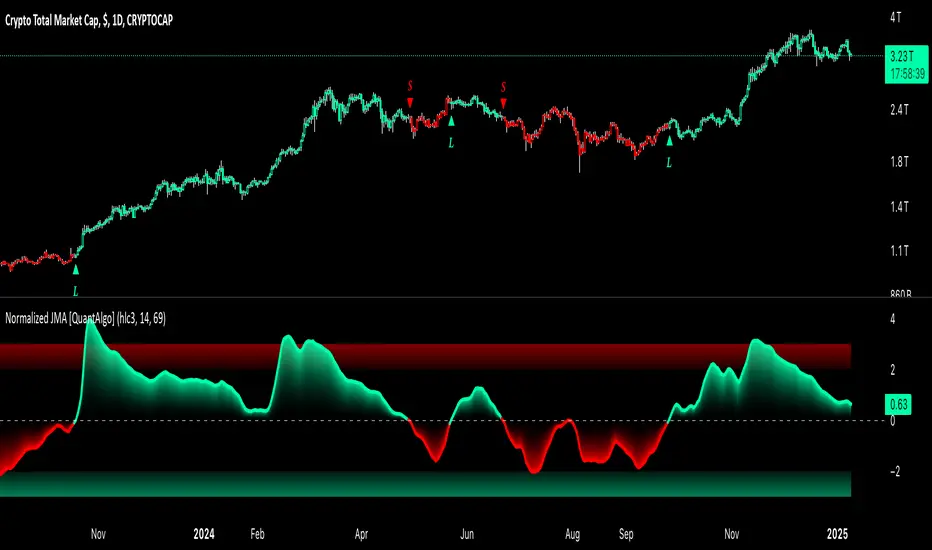
- Color-adaptive oscillator line that reflects momentum strength and direction
- Statistically significant overbought/oversold zones for trade validation
- Smart gradient fills between signal line and zero level for enhanced visualization
- Clear long (L) and short (S) markers for validated momentum shifts
- Intelligent bar coloring that highlights the current market state
- Customizable alert system for both bullish and bearish setups
🟢 Practical Usage Tips
Here's how to maximize your use of the Normalized JMA:
1/ Setup:
- Add the indicator to your favorites, then apply it to your chart ⭐️
- Begin with the default smoothing period for balanced analysis
- Use the default normalization period for optimal signal generation
- Start with standard visualization settings
- Customize colors to match your chart preferences
- Enable both bar coloring and signal markers for complete visual feedback
2/ Reading Signals:
- Watch for L/S markers - they indicate validated momentum shifts
- Monitor oscillator line color changes for direction confirmation
- Use the built-in alert system to stay informed of potential trend changes
🟢 Pro Tips
- Adjust Smoothing Period based on your trading style:
→ Lower values (8-12) for more responsive signals
→ Higher values (20-30) for more stable trend identification
- Fine-tune Normalization Period based on market conditions:
→ Shorter periods (20-25) for more dynamic markets
→ Longer periods (40-50) for more stable markets
- Optimize your analysis by:
→ Using +2/-2 zones for primary trade signals
→ Using +3/-3 zones for extreme market conditions
→ Combining with volume analysis for trade confirmation
→ Using multiple timeframe analysis for strategic context
- Combine with:
→ Volume indicators for trade validation
→ Price action for entry timing
→ Support/resistance levels for profit targets
→ Trend-following indicators for directional bias
오픈 소스 스크립트
트레이딩뷰의 진정한 정신에 따라, 이 스크립트의 작성자는 이를 오픈소스로 공개하여 트레이더들이 기능을 검토하고 검증할 수 있도록 했습니다. 작성자에게 찬사를 보냅니다! 이 코드는 무료로 사용할 수 있지만, 코드를 재게시하는 경우 하우스 룰이 적용된다는 점을 기억하세요.
👉 Access our best trading & investing tools here (3-day FREE trial): whop.com/quantalgo/
면책사항
해당 정보와 게시물은 금융, 투자, 트레이딩 또는 기타 유형의 조언이나 권장 사항으로 간주되지 않으며, 트레이딩뷰에서 제공하거나 보증하는 것이 아닙니다. 자세한 내용은 이용 약관을 참조하세요.