INVITE-ONLY SCRIPT
Varma Fractal TEMA Indicator
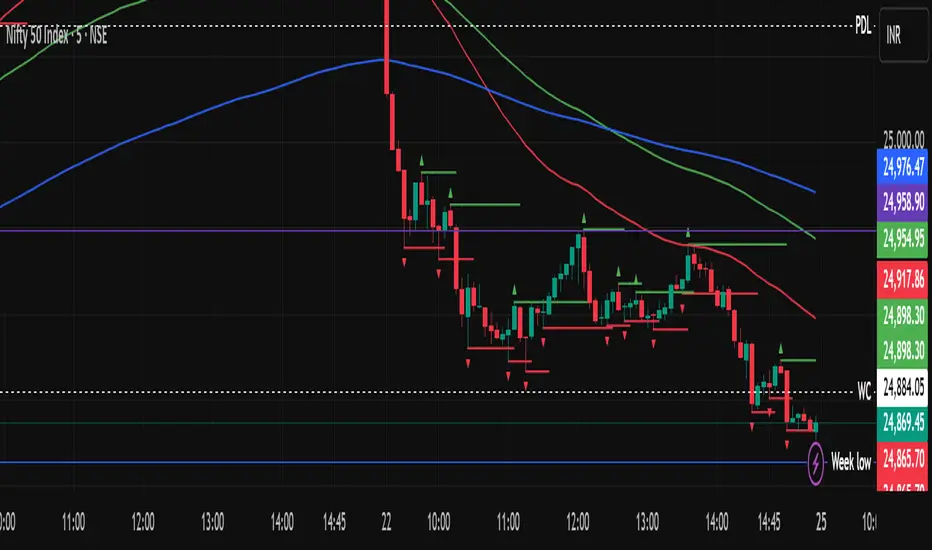
The Indicator uses Fractals and Three EMAs. A fractal is a repeating price pattern, typically consisting of five candlesticks, used to identify potential trend reversals or continuations. A bullish fractal suggests a possible upward price movement, while a bearish fractal indicates a potential downward trend. These patterns, popularized by Bill Williams, can be found across different timeframes and are considered a key part of his technical analysis system. Every Fractal line acts as an immediate support or resistance. The use of three EMAs in trading is well known. One can make own strategies with them.
초대 전용 스크립트
이 스크립트는 작성자가 승인한 사용자만 접근할 수 있습니다. 사용하려면 요청 후 승인을 받아야 하며, 일반적으로 결제 후에 허가가 부여됩니다. 자세한 내용은 아래 작성자의 안내를 따르거나 varmasudhakar에게 직접 문의하세요.
트레이딩뷰는 스크립트의 작동 방식을 충분히 이해하고 작성자를 완전히 신뢰하지 않는 이상, 해당 스크립트에 비용을 지불하거나 사용하는 것을 권장하지 않습니다. 커뮤니티 스크립트에서 무료 오픈소스 대안을 찾아보실 수도 있습니다.
작성자 지시 사항
ENTRY FOR LONG:(When the price is above 200 EMA and above 20 EMA line :Source: High in settings) *At the close of the green candle, which crosses the nearest green fractal level
ENTRY FOR SHORT: (When the price is below the 200 EMA and 20 EMA) in reverse
면책사항
해당 정보와 게시물은 금융, 투자, 트레이딩 또는 기타 유형의 조언이나 권장 사항으로 간주되지 않으며, 트레이딩뷰에서 제공하거나 보증하는 것이 아닙니다. 자세한 내용은 이용 약관을 참조하세요.