PROTECTED SOURCE SCRIPT
업데이트됨 KDJ F-CUSTOM
なぞです
릴리즈 노트
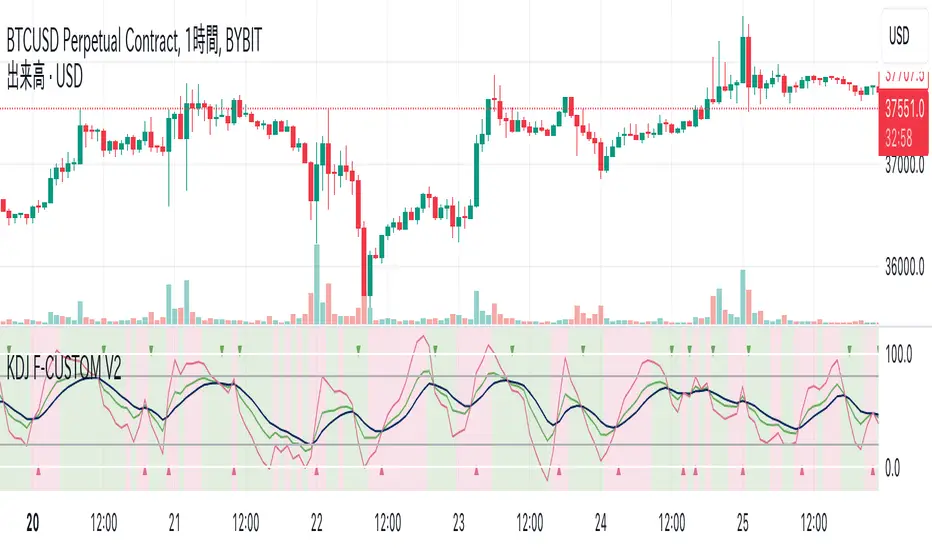
KDJ F-CUSTOM V2 IndicatorThe "KDJ F-CUSTOM V2" is a customized version based on the classic KDJ indicator. This indicator is designed to suggest overbought and oversold conditions in the market. The KDJ consists of three lines: %K (pK), %D (pD), and %J (pJ), which help identify market momentum and potential trend reversal points.
Key Features:
pK, pD, pJ Lines: Corresponding to the %K, %D, and %J lines of the KDJ, respectively, these lines indicate market momentum and potential turning points.
Crossover Display: The crossover of pJ and pD is an important signal that suggests turning points in the market. These points are displayed in a special shape on the chart.
Customizable Display: Users can choose to display the pK, pD, pJ lines, crossover points, and horizontal lines at 20 and 80.
Transparent Background Color: The background color changes depending on whether the pJ line is above or below its previous value. This helps visually track market movements.
How to Use:
Identifying Trends: When the pK, pD, and pJ lines cross upwards or downwards, it suggests a change in the market trend.
Identifying Overbought/Oversold Conditions: When the pJ line reaches extreme high or low values (usually around 0 or 100), it may indicate that the market is in an overbought or oversold condition.
※This indicator is useful for understanding market dynamics and identifying potential entry and exit points. It is recommended to use it in conjunction with other technical analysis tools and fundamental market analysis when integrating into a trading strategy.
보호된 스크립트입니다
이 스크립트는 비공개 소스로 게시됩니다. 하지만 이를 자유롭게 제한 없이 사용할 수 있습니다 – 자세한 내용은 여기에서 확인하세요.
면책사항
해당 정보와 게시물은 금융, 투자, 트레이딩 또는 기타 유형의 조언이나 권장 사항으로 간주되지 않으며, 트레이딩뷰에서 제공하거나 보증하는 것이 아닙니다. 자세한 내용은 이용 약관을 참조하세요.
보호된 스크립트입니다
이 스크립트는 비공개 소스로 게시됩니다. 하지만 이를 자유롭게 제한 없이 사용할 수 있습니다 – 자세한 내용은 여기에서 확인하세요.
면책사항
해당 정보와 게시물은 금융, 투자, 트레이딩 또는 기타 유형의 조언이나 권장 사항으로 간주되지 않으며, 트레이딩뷰에서 제공하거나 보증하는 것이 아닙니다. 자세한 내용은 이용 약관을 참조하세요.