OPEN-SOURCE SCRIPT
CMYK RYTHM

◊ Introduction
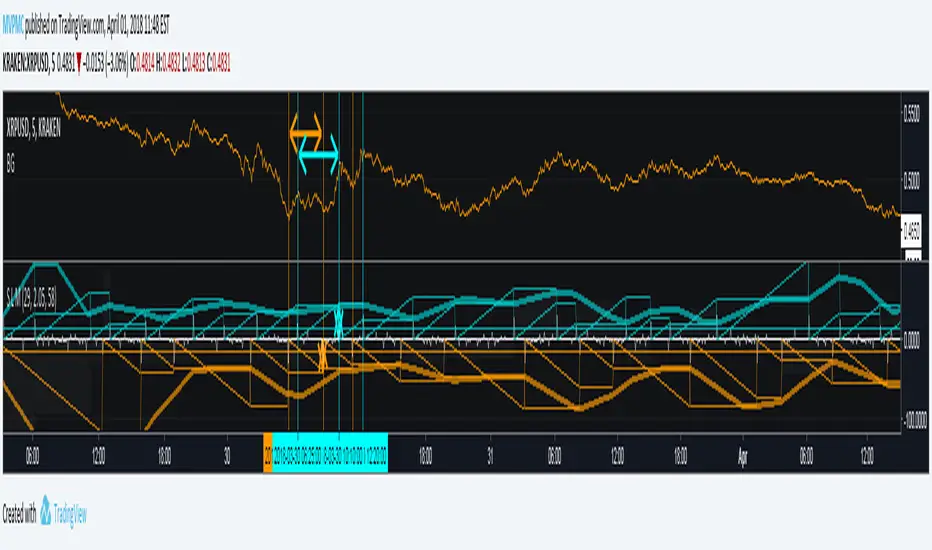
This script makes use of a sliding matrix, to search the highest/lowest point in the slider, it then counts the amount of times it was high/low, giving the distance from a previous high/low.
Every High/low are granted values, being a lower value for shorted periods, and a larger value for Longer periods.
This reveals the different period lengths of active frequencies.
Doing this with different slider lenghts would result in measuring with different mean period lenghts.
◊ Origin
From my dream last night.
This is a part of Project XIAM.
◊ Theoretical Approach
Philosophy β :: Rythmic
Searching for the period lenght of several frequencys at once.
◊ Usage
This is an alalythical tool, to be used for Automatically adjusting settings on Indicators that presume a period length for calculation.
Calculations are based on Past values, and no reversal measures or fail-safes are applied, so it will only be useful during a continuation of trend.
◊ Features
Matrix Calculation of Lowest/Highest points in a sliding series with Steady Length.
In the future Several slider lenghts will be applied to search for Frequencies of different magnitudes.
Lenght between TOPS, DIPS , and an SMA that smoothens this.
BIAS Is TOP to DIP Minus DIP to TOP, to uncover Bullish/Bearish index of market movements.
◊ Community
CMYK :: discord.gg/bg2TDvh
AUTOVIEW :: discordapp.com/invite/BFz8VPn
TRADINGVIEW UNOFFICIAL :: discord.gg/fZFcJBy
오픈 소스 스크립트
트레이딩뷰의 진정한 정신에 따라, 이 스크립트의 작성자는 이를 오픈소스로 공개하여 트레이더들이 기능을 검토하고 검증할 수 있도록 했습니다. 작성자에게 찬사를 보냅니다! 이 코드는 무료로 사용할 수 있지만, 코드를 재게시하는 경우 하우스 룰이 적용된다는 점을 기억하세요.
MVPMC
면책사항
해당 정보와 게시물은 금융, 투자, 트레이딩 또는 기타 유형의 조언이나 권장 사항으로 간주되지 않으며, 트레이딩뷰에서 제공하거나 보증하는 것이 아닙니다. 자세한 내용은 이용 약관을 참조하세요.
오픈 소스 스크립트
트레이딩뷰의 진정한 정신에 따라, 이 스크립트의 작성자는 이를 오픈소스로 공개하여 트레이더들이 기능을 검토하고 검증할 수 있도록 했습니다. 작성자에게 찬사를 보냅니다! 이 코드는 무료로 사용할 수 있지만, 코드를 재게시하는 경우 하우스 룰이 적용된다는 점을 기억하세요.
MVPMC
면책사항
해당 정보와 게시물은 금융, 투자, 트레이딩 또는 기타 유형의 조언이나 권장 사항으로 간주되지 않으며, 트레이딩뷰에서 제공하거나 보증하는 것이 아닙니다. 자세한 내용은 이용 약관을 참조하세요.