OPEN-SOURCE SCRIPT
업데이트됨 HVC Daily Levels
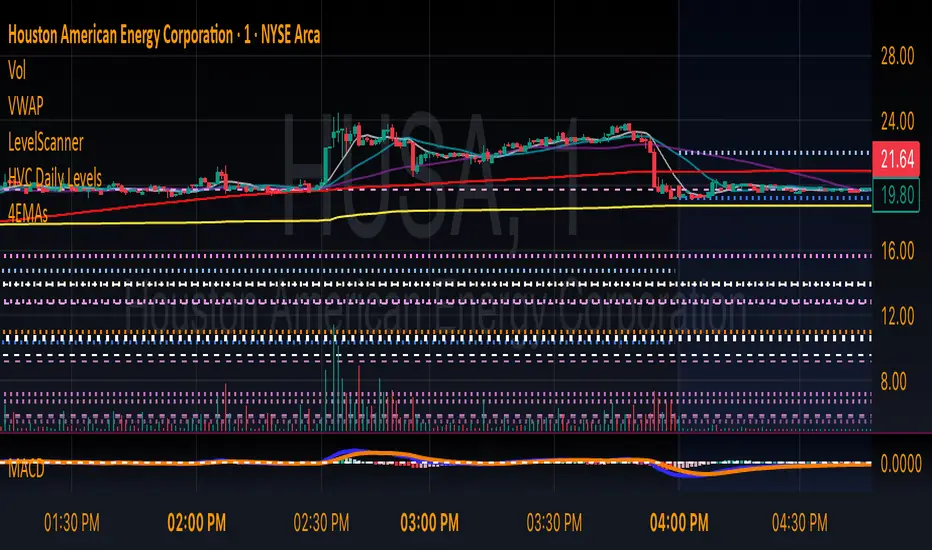
Daily High Volume Candle Levels Marked on all Timeframes
HVC Level Sentinel v6 — High Volume Candle Levels
HVC Level Sentinel v6 automatically detects and highlights “High Volume Candles” (HVCs) — bars with the highest trading volume in a rolling, user-defined window (e.g., 30 days). This tool helps you spot key price levels where significant trading activity occurred, which can act as important support or resistance zones.
Features
Customizable Lookback: Choose how many bars to look back for HVC detection (default: 30 days, adjustable).
Automatic Highlighting: HVC candles are highlighted on your chart with a customizable color.
Level Lines: Draws horizontal lines at the Open, High, Low, and Close of each recent HVC, so you can easily track these key levels.
Line Fading: Only the most recent N HVCs (user-adjustable) have lines, with older lines fading out or disappearing for clarity.
Per-Line Control: Turn on/off Open, High, Low, and Close lines individually in the settings.
Fully Customizable: Adjust colors, line styles, widths, and opacity to fit your chart style.
How It Works
On each new bar, the script checks if the current bar’s volume is the highest in the last N bars.
If so, it marks the bar as an HVC and draws lines at its O/H/L/C (if enabled).
You can highlight all HVCs historically, but only the most recent N will have lines for a clean, focused chart.
Use Cases
Identify major breakout or reversal points driven by high volume.
Track where institutional or “smart money” activity may have occurred.
Use HVC levels as dynamic support/resistance for entries, exits, or stop placement.
Tip:
Adjust the lookback window and number of HVCs with lines to match your trading style—shorter for active trading, longer for swing/position trading.
릴리즈 노트
Daily High Volume Candle Levels Marked on all TimeframesHVC Level Sentinel v6 — High Volume Candle Levels
HVC Level Sentinel v6 automatically detects and highlights “High Volume Candles” (HVCs) — bars with the highest trading volume in a rolling, user-defined window (e.g., 30 days). This tool helps you spot key price levels where significant trading activity occurred, which can act as important support or resistance zones.
Features
Customizable Lookback: Choose how many bars to look back for HVC detection (default: 30 days, adjustable).
Automatic Highlighting: HVC candles are highlighted on your chart with a customizable color.
Level Lines: Draws horizontal lines at the Open, High, Low, and Close of each recent HVC, so you can easily track these key levels.
Line Fading: Only the most recent N HVCs (user-adjustable) have lines, with older lines fading out or disappearing for clarity.
Per-Line Control: Turn on/off Open, High, Low, and Close lines individually in the settings.
Fully Customizable: Adjust colors, line styles, widths, and opacity to fit your chart style.
How It Works
On each new bar, the script checks if the current bar’s volume is the highest in the last N bars.
If so, it marks the bar as an HVC and draws lines at its O/H/L/C (if enabled).
You can highlight all HVCs historically, but only the most recent N will have lines for a clean, focused chart.
Use Cases
Identify major breakout or reversal points driven by high volume.
Track where institutional or “smart money” activity may have occurred.
Use HVC levels as dynamic support/resistance for entries, exits, or stop placement.
Tip:
Adjust the lookback window and number of HVCs with lines to match your trading style—shorter for active trading, longer for swing/position trading.
오픈 소스 스크립트
트레이딩뷰의 진정한 정신에 따라, 이 스크립트의 작성자는 이를 오픈소스로 공개하여 트레이더들이 기능을 검토하고 검증할 수 있도록 했습니다. 작성자에게 찬사를 보냅니다! 이 코드는 무료로 사용할 수 있지만, 코드를 재게시하는 경우 하우스 룰이 적용된다는 점을 기억하세요.
면책사항
해당 정보와 게시물은 금융, 투자, 트레이딩 또는 기타 유형의 조언이나 권장 사항으로 간주되지 않으며, 트레이딩뷰에서 제공하거나 보증하는 것이 아닙니다. 자세한 내용은 이용 약관을 참조하세요.
오픈 소스 스크립트
트레이딩뷰의 진정한 정신에 따라, 이 스크립트의 작성자는 이를 오픈소스로 공개하여 트레이더들이 기능을 검토하고 검증할 수 있도록 했습니다. 작성자에게 찬사를 보냅니다! 이 코드는 무료로 사용할 수 있지만, 코드를 재게시하는 경우 하우스 룰이 적용된다는 점을 기억하세요.
면책사항
해당 정보와 게시물은 금융, 투자, 트레이딩 또는 기타 유형의 조언이나 권장 사항으로 간주되지 않으며, 트레이딩뷰에서 제공하거나 보증하는 것이 아닙니다. 자세한 내용은 이용 약관을 참조하세요.