OPEN-SOURCE SCRIPT
업데이트됨 Elgrand - Overbought/sold Rsi + Stochastic zones
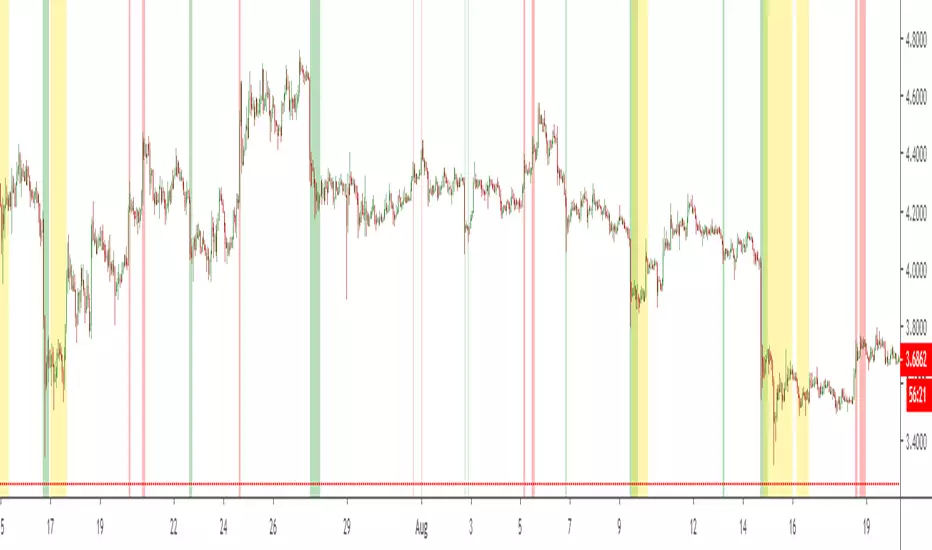
Visualize on your chart when price in an oversold or overbought zone. A combination of Rsi and Stochasticrsi is used for higher probability. Wait for an zone to be displayed and then wait for price to exit a zone. Once this happens check candlestick patterns and support/resistance "lines" to find appropiate stoplosses for you entry or exit
릴리즈 노트
Update :- Upgraded to use version 4 of Pinescript
Added and extra timeframe which will show in yellow on your chart : this way you can decide to enter exit if 1H overbought/oversold is also happening on the 4H timeframe. Idea is that this will lower your entry/exit risk.
Todo :
- Make the parent timeframe display optional
Be able to choose per timeframe which parent timeframe you would like to use
오픈 소스 스크립트
트레이딩뷰의 진정한 정신에 따라, 이 스크립트의 작성자는 이를 오픈소스로 공개하여 트레이더들이 기능을 검토하고 검증할 수 있도록 했습니다. 작성자에게 찬사를 보냅니다! 이 코드는 무료로 사용할 수 있지만, 코드를 재게시하는 경우 하우스 룰이 적용된다는 점을 기억하세요.
면책사항
해당 정보와 게시물은 금융, 투자, 트레이딩 또는 기타 유형의 조언이나 권장 사항으로 간주되지 않으며, 트레이딩뷰에서 제공하거나 보증하는 것이 아닙니다. 자세한 내용은 이용 약관을 참조하세요.
오픈 소스 스크립트
트레이딩뷰의 진정한 정신에 따라, 이 스크립트의 작성자는 이를 오픈소스로 공개하여 트레이더들이 기능을 검토하고 검증할 수 있도록 했습니다. 작성자에게 찬사를 보냅니다! 이 코드는 무료로 사용할 수 있지만, 코드를 재게시하는 경우 하우스 룰이 적용된다는 점을 기억하세요.
면책사항
해당 정보와 게시물은 금융, 투자, 트레이딩 또는 기타 유형의 조언이나 권장 사항으로 간주되지 않으며, 트레이딩뷰에서 제공하거나 보증하는 것이 아닙니다. 자세한 내용은 이용 약관을 참조하세요.