INVITE-ONLY SCRIPT
Trend Direction & Levels Identifier
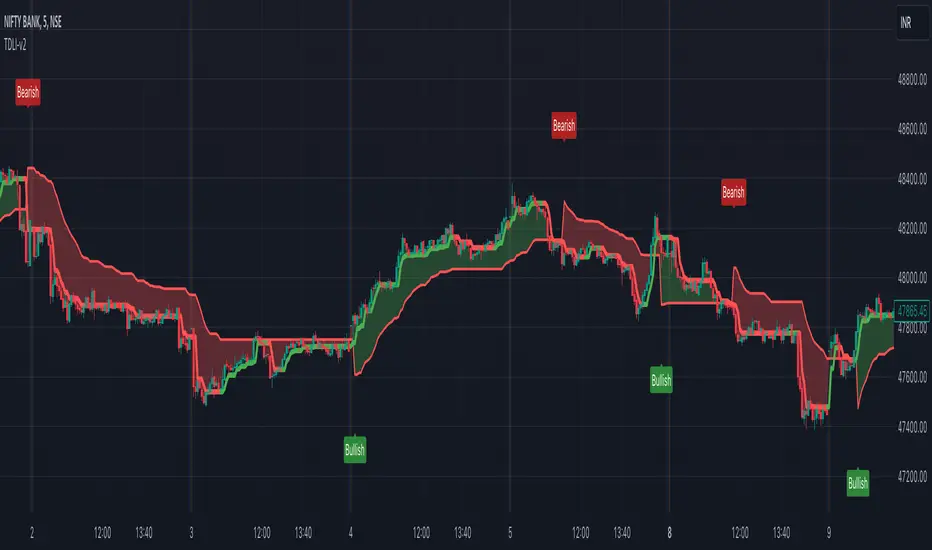
Overview : Trend Direction & Levels Identifier (TDLI) provides you with two lines - Resistance/Support line (RSLine) and Trend Line. These two lines form a channel which is filled with a colour showing current market direction, which also prints Bullish or Bearish text. Trend Line calculation is similar but follows different approach than Super Trend indicator. RSLine calculation is done using EMA and dynamic ATR.
How does this work?
Firstly understand Supertrend - The Supertrend indicator is a freely available technical analysis tool that helps traders identify the direction of the trend . It is based on the concept of volatility, and it provides a simple way to identify whether the current market trend is bullish or bearish.
Here's a basic explanation of the Supertrend indicator's logic and how it is commonly used:
Supertrend Indicator Logic:
Calculation of Average True Range (ATR) : The first step involves calculating the Average True Range (ATR) over a specified period. ATR measures market volatility by considering the average range between the high and low prices over a given number of periods.
Multiplier Factor : A multiplier factor is then applied to the ATR. The multiplier is usually set by the trader or analyst and determines the sensitivity of the Supertrend to changes in volatility.
Calculation of Upper and Lower Bands:The Supertrend indicator calculates two bands - an upper band and a lower band.
Upper Band (UB) = High price - (Multiplier * ATR)
Lower Band (LB) = Low price + (Multiplier * ATR)
Determining Trend Direction : If the current market price is above the Upper Band, the Supertrend suggests a bearish trend (sell signal). If the current market price is below the Lower Band, the Supertrend suggests a bullish trend (buy signal).
Now, Let's understand how we use this logic with some modification to build our Trend line -
Let's break down the key differences:
1. Calculation of Trend Switch Points:
- Supertrend: The Supertrend indicator primarily relies on the Average True Range (ATR) to calculate the volatility of the market. It then determines trend direction based on whether the closing price is above or below the Supertrend line.
- Our Trend: We use a modified ATR for volatility measurement (ATR / x), our code introduces modifications in the calculation of trend switch points. It incorporates moving averages (SMA - Simple Moving Averages) to define high and low prices, adding a dynamic element to the identification of trend reversal points.
2. Trend States and Switch Logic:
- Supertrend: The Supertrend generally has two states: uptrend or downtrend. It switches its state when the closing price crosses the Supertrend line.
- Our Trend: Our code introduces an additional variable, which is not binary (0 or 1) but rather represents the state of the trend (0 for uptrend, 1 for downtrend). The indicator uses a more complex logic involving previous trend states and moving averages to determine trend switches.
So, our trend line incorporates additional elements such as moving averages, dynamic amplitude, and channel deviation to modify the Supertrend logic and provide a more nuanced and visually informative representation of market trends. These modifications offer traders more flexibility in adapting the indicator to different market conditions and trading preferences.
Remember the underlying logic is of Supertrend which is freely available to all.
Another line is RSLine, lets dive into its logic and calculation -
Average True Range (ATR) Calculation : Calculates the Average True Range, a measure of market volatility. The ATR can be dynamically adjusted based on user preference.
Chande Momentum Oscillator (CMO) and Variable (VAR) Calculation : Calculates the CMO, which measures momentum, and uses it to compute the VAR value. This introduces an adaptive element to the indicator.
Other Moving Averages : Calculates various moving averages, including Wilder's Moving Average (WWMA), Zero-Lag Exponential Moving Average (ZLEMA), and Time Series Forecast (TSF), providing different perspectives on trend direction.
Main Moving Average (MAvg) Calculation : Computes the main moving average based on EMA and length.
Stop Level Calculation : Determines stop levels for both long and short positions. The levels are influenced by the moving average (MAvg) and ATR, with an option to normalize them.
The Stop Levels forms the RSLine which acts as either resistance or support based on market direction.
Lets see how the indicator tells you probable market direction -
Direction Identification : Identifies the current trend direction (uptrend or downtrend) based on the relationship between the moving average and the previous stop level. It also prints Bullish or Bearish on chart based on crossovers and crossunders between the Trend Line and the RSLine.
Fill Coloring for Highlighting : It Fills the area between the Trend Line and RSLine with either green or red color to visually emphasize the trend direction. The colors change based on whether the Trend Line and MAvg is above or below the stop levels.
So there are 3 major things -
1. RSLine - Uses EMA and dynamic ATR to calculate stop levels. This acts as support or resistance to current trend. It is always red in colour.
2. Trend Line - Unlike Super Trend this Trend Line calculation uses a combination of highest high, lowest low, and EMA of a fixed range of candles to determine trend changes. It uses a fixed amplitude for calculating the highest high, lowest low, and EMA values, but it doesn't incorporate dynamic volatility adjustments like ATR. Its colour varies from red to green based on calculation.
3. Channel Colour - Channel colour is decided based on crossover of Trend Line and RSLine, if Trend Line crosses RSLine from bottom then channel colour becomes green, similarly red colour is calculated.
How to use this?
Refer this snapshot for content below -

1. Once a crossover happens between Trend Line and RSLine, bullish / bearish text is printed with change in colour of channel. RSLine acts as support/resistance.
2. Look for colour of Trend Line - when it matches channel colour, it means favourable direction is that colour (green - long, red - short)
3. Remember any ongoing trend can reverse any second, so follow price action for better results.
Preferred Timeframe : It works best in 5 minute timeframe, but can also be used in other time frames.
Reason to use these two lines ?
The Trend Line tells current trend direction using a line which keeps changing colours, for double confirmation we use the RSline and channel colour which is calculated using Trend line and RSLine crossover. When both Trend line and RSLine channel colour is same that gives a more solid confirmation (not 100%) of a trend
Why it is worth paying for :
As mentioned earlier this indicator is built over freely available Supertrend and EMA indicators. The modifications which we have done for better calculation and visualisation makes it worth.
The indicator may be considered valuable for traders who appreciate a visual representation of market trend direction and important stop levels. Normal indicators like supertrend just shows a line which gives you idea about the trend but our indicator apart from telling trend direction tells important levels and provide a channel filled with current trend direction significance which helps in following trend precisely.
1. The customization options and visual clarity could enhance decision-making for those who prefer a more tailored approach.
2. Traders willing to pay for this indicator may find it useful in complementing their existing analysis and strategy.
Although one should understand using premium indicator doesnt mean it will generate magic results, if you know price action and risk management properly then only consider trying our indicator else practice trading on free indicators first.
IMPORTANT : As Stock markets are dynamic in nature, no indicator is a magic indicator which will give you 100% accurate results on one click. You still have to use price action for best results.
DISCLAIMER : This indicator isn't a get rich quick scheme, neither it can provide 100% accurate results. It is meant to be used as an aid to Price Action Trading and proper risk management.
How does this work?
Firstly understand Supertrend - The Supertrend indicator is a freely available technical analysis tool that helps traders identify the direction of the trend . It is based on the concept of volatility, and it provides a simple way to identify whether the current market trend is bullish or bearish.
Here's a basic explanation of the Supertrend indicator's logic and how it is commonly used:
Supertrend Indicator Logic:
Calculation of Average True Range (ATR) : The first step involves calculating the Average True Range (ATR) over a specified period. ATR measures market volatility by considering the average range between the high and low prices over a given number of periods.
Multiplier Factor : A multiplier factor is then applied to the ATR. The multiplier is usually set by the trader or analyst and determines the sensitivity of the Supertrend to changes in volatility.
Calculation of Upper and Lower Bands:The Supertrend indicator calculates two bands - an upper band and a lower band.
Upper Band (UB) = High price - (Multiplier * ATR)
Lower Band (LB) = Low price + (Multiplier * ATR)
Determining Trend Direction : If the current market price is above the Upper Band, the Supertrend suggests a bearish trend (sell signal). If the current market price is below the Lower Band, the Supertrend suggests a bullish trend (buy signal).
Now, Let's understand how we use this logic with some modification to build our Trend line -
Let's break down the key differences:
1. Calculation of Trend Switch Points:
- Supertrend: The Supertrend indicator primarily relies on the Average True Range (ATR) to calculate the volatility of the market. It then determines trend direction based on whether the closing price is above or below the Supertrend line.
- Our Trend: We use a modified ATR for volatility measurement (ATR / x), our code introduces modifications in the calculation of trend switch points. It incorporates moving averages (SMA - Simple Moving Averages) to define high and low prices, adding a dynamic element to the identification of trend reversal points.
2. Trend States and Switch Logic:
- Supertrend: The Supertrend generally has two states: uptrend or downtrend. It switches its state when the closing price crosses the Supertrend line.
- Our Trend: Our code introduces an additional variable, which is not binary (0 or 1) but rather represents the state of the trend (0 for uptrend, 1 for downtrend). The indicator uses a more complex logic involving previous trend states and moving averages to determine trend switches.
So, our trend line incorporates additional elements such as moving averages, dynamic amplitude, and channel deviation to modify the Supertrend logic and provide a more nuanced and visually informative representation of market trends. These modifications offer traders more flexibility in adapting the indicator to different market conditions and trading preferences.
Remember the underlying logic is of Supertrend which is freely available to all.
Another line is RSLine, lets dive into its logic and calculation -
Average True Range (ATR) Calculation : Calculates the Average True Range, a measure of market volatility. The ATR can be dynamically adjusted based on user preference.
Chande Momentum Oscillator (CMO) and Variable (VAR) Calculation : Calculates the CMO, which measures momentum, and uses it to compute the VAR value. This introduces an adaptive element to the indicator.
Other Moving Averages : Calculates various moving averages, including Wilder's Moving Average (WWMA), Zero-Lag Exponential Moving Average (ZLEMA), and Time Series Forecast (TSF), providing different perspectives on trend direction.
Main Moving Average (MAvg) Calculation : Computes the main moving average based on EMA and length.
Stop Level Calculation : Determines stop levels for both long and short positions. The levels are influenced by the moving average (MAvg) and ATR, with an option to normalize them.
The Stop Levels forms the RSLine which acts as either resistance or support based on market direction.
Lets see how the indicator tells you probable market direction -
Direction Identification : Identifies the current trend direction (uptrend or downtrend) based on the relationship between the moving average and the previous stop level. It also prints Bullish or Bearish on chart based on crossovers and crossunders between the Trend Line and the RSLine.
Fill Coloring for Highlighting : It Fills the area between the Trend Line and RSLine with either green or red color to visually emphasize the trend direction. The colors change based on whether the Trend Line and MAvg is above or below the stop levels.
So there are 3 major things -
1. RSLine - Uses EMA and dynamic ATR to calculate stop levels. This acts as support or resistance to current trend. It is always red in colour.
2. Trend Line - Unlike Super Trend this Trend Line calculation uses a combination of highest high, lowest low, and EMA of a fixed range of candles to determine trend changes. It uses a fixed amplitude for calculating the highest high, lowest low, and EMA values, but it doesn't incorporate dynamic volatility adjustments like ATR. Its colour varies from red to green based on calculation.
3. Channel Colour - Channel colour is decided based on crossover of Trend Line and RSLine, if Trend Line crosses RSLine from bottom then channel colour becomes green, similarly red colour is calculated.
How to use this?
Refer this snapshot for content below -
1. Once a crossover happens between Trend Line and RSLine, bullish / bearish text is printed with change in colour of channel. RSLine acts as support/resistance.
2. Look for colour of Trend Line - when it matches channel colour, it means favourable direction is that colour (green - long, red - short)
3. Remember any ongoing trend can reverse any second, so follow price action for better results.
Preferred Timeframe : It works best in 5 minute timeframe, but can also be used in other time frames.
Reason to use these two lines ?
The Trend Line tells current trend direction using a line which keeps changing colours, for double confirmation we use the RSline and channel colour which is calculated using Trend line and RSLine crossover. When both Trend line and RSLine channel colour is same that gives a more solid confirmation (not 100%) of a trend
Why it is worth paying for :
As mentioned earlier this indicator is built over freely available Supertrend and EMA indicators. The modifications which we have done for better calculation and visualisation makes it worth.
The indicator may be considered valuable for traders who appreciate a visual representation of market trend direction and important stop levels. Normal indicators like supertrend just shows a line which gives you idea about the trend but our indicator apart from telling trend direction tells important levels and provide a channel filled with current trend direction significance which helps in following trend precisely.
1. The customization options and visual clarity could enhance decision-making for those who prefer a more tailored approach.
2. Traders willing to pay for this indicator may find it useful in complementing their existing analysis and strategy.
Although one should understand using premium indicator doesnt mean it will generate magic results, if you know price action and risk management properly then only consider trying our indicator else practice trading on free indicators first.
IMPORTANT : As Stock markets are dynamic in nature, no indicator is a magic indicator which will give you 100% accurate results on one click. You still have to use price action for best results.
DISCLAIMER : This indicator isn't a get rich quick scheme, neither it can provide 100% accurate results. It is meant to be used as an aid to Price Action Trading and proper risk management.
초대 전용 스크립트
이 스크립트는 작성자가 승인한 사용자만 접근할 수 있습니다. 사용하려면 요청 후 승인을 받아야 하며, 일반적으로 결제 후에 허가가 부여됩니다. 자세한 내용은 아래 작성자의 안내를 따르거나 LossBros에게 직접 문의하세요.
트레이딩뷰는 스크립트의 작동 방식을 충분히 이해하고 작성자를 완전히 신뢰하지 않는 이상, 해당 스크립트에 비용을 지불하거나 사용하는 것을 권장하지 않습니다. 커뮤니티 스크립트에서 무료 오픈소스 대안을 찾아보실 수도 있습니다.
작성자 지시 사항
For access to this indicator visit http://www.lossbros.com or contact us in DM.
면책사항
해당 정보와 게시물은 금융, 투자, 트레이딩 또는 기타 유형의 조언이나 권장 사항으로 간주되지 않으며, 트레이딩뷰에서 제공하거나 보증하는 것이 아닙니다. 자세한 내용은 이용 약관을 참조하세요.