OPEN-SOURCE SCRIPT
[KVA] KATR
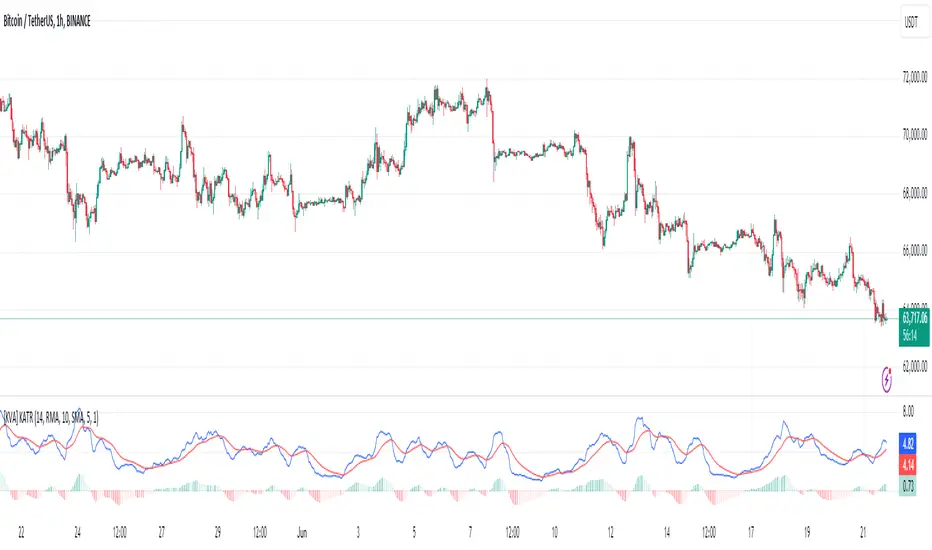
The [KVA] KATR indicator enhances the traditional ATR by leveraging the most common candle body percentage range, tailoring volatility measurement to specific market contexts. This advanced tool provides more relevant insights tailored to current market conditions.
Key Features:
Configurable ATR Length: Allows users to set the period for the ATR calculation, providing flexibility to adapt to different trading strategies and timeframes.
Multiple Smoothing Options: Offers a choice of RMA, SMA, EMA, and WMA for smoothing the ATR, enabling traders to select the method that best suits their analysis style.
Histogram Visualization for ATR Differences: The histogram visually represents the difference between the ATR and its moving average. This difference, or "dif," is calculated and smoothed, then multiplied by a user-defined factor. The histogram color indicates market conditions:
Light Red: Increasing but below zero, signaling potential weakening.
Light Green: Increasing and above zero, indicating strengthening.
Dark Green: Decreasing but above zero, showing potential weakening.
Dark Red: Decreasing and below zero, indicating strong weakening.
Ideal for Traders:
This indicator is perfect for traders seeking precise, context-sensitive volatility assessments to optimize trade timing and risk management strategies. Integrated seamlessly with other technical indicators, the KATR enhances your trading dashboard by adding depth to volatility analysis.
Detailed Explanation:
ATR Calculation: The ATR is derived by taking the average true range over a specified period, multiplied by the most common body percentage found in historical data.
Smoothing: Users can smooth the ATR using different methods, adding flexibility and customization to suit various trading styles.
Histogram: The histogram's primary function is to visualize the difference between the current ATR and its smoothed average. This provides clear, visual signals for potential volatility expansions or contractions, aiding in better decision-making.
Whether you're a day trader or a long-term investor, the KATR helps you stay ahead of market trends with reliable and easy-to-interpret insights. Elevate your trading strategy with the KATR's innovative approach to volatility measurement.
오픈 소스 스크립트
트레이딩뷰의 진정한 정신에 따라, 이 스크립트의 작성자는 이를 오픈소스로 공개하여 트레이더들이 기능을 검토하고 검증할 수 있도록 했습니다. 작성자에게 찬사를 보냅니다! 이 코드는 무료로 사용할 수 있지만, 코드를 재게시하는 경우 하우스 룰이 적용된다는 점을 기억하세요.
면책사항
해당 정보와 게시물은 금융, 투자, 트레이딩 또는 기타 유형의 조언이나 권장 사항으로 간주되지 않으며, 트레이딩뷰에서 제공하거나 보증하는 것이 아닙니다. 자세한 내용은 이용 약관을 참조하세요.
오픈 소스 스크립트
트레이딩뷰의 진정한 정신에 따라, 이 스크립트의 작성자는 이를 오픈소스로 공개하여 트레이더들이 기능을 검토하고 검증할 수 있도록 했습니다. 작성자에게 찬사를 보냅니다! 이 코드는 무료로 사용할 수 있지만, 코드를 재게시하는 경우 하우스 룰이 적용된다는 점을 기억하세요.
면책사항
해당 정보와 게시물은 금융, 투자, 트레이딩 또는 기타 유형의 조언이나 권장 사항으로 간주되지 않으며, 트레이딩뷰에서 제공하거나 보증하는 것이 아닙니다. 자세한 내용은 이용 약관을 참조하세요.