OPEN-SOURCE SCRIPT
CM_Blast_Off_V1_Alerts Ready

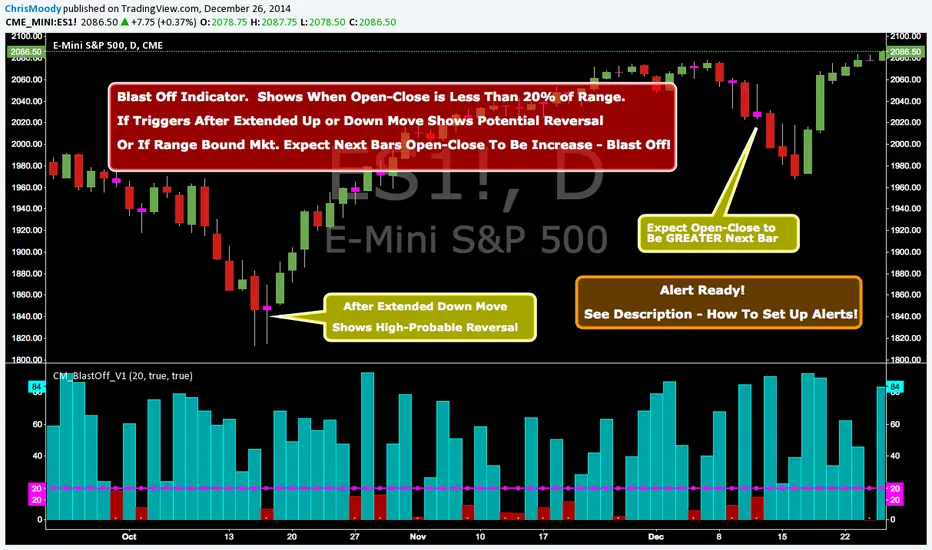
Blast Off Indicator - Alert Ready!!!
Created By Request from @elpuerto936c
Description of Indicator:
***This measures the day's open / close vs then high lows of the day (range)
***When the open /close is less than 20% of the range, then it's likely that the following day will have a big jump.
***The Thought Process is Simply When (Open - Close) is Less Than 20% Of The Range…Shows Indecision and Breakout is Probable.
***Which way? Use whatever indicator you want to figure out if the market is oversold or overbought.
***NOTE: If Indicator Triggers After Extended Up or Down Move…This = High Probability Reversal.
In Inputs Tab:
-Ability to Change The Trigger Value…(This is Percent The (Open-Close) is to the Total RANGE of The Bar).
-Ability to Turn On/Off Highlight Bars via Check Box.
To Set Alert:
-In First Drop Down Box Select Name of Indicator
-In Drop Down to Right Select “Alert Blast Off If Below Trigger”.
-Then Select “Greater Than”.
-Then Select “Value”
-To the Right of Value type in .99
-Select On Bar Close, If not you will get FALSE Alerts.
오픈 소스 스크립트
트레이딩뷰의 진정한 정신에 따라, 이 스크립트의 작성자는 이를 오픈소스로 공개하여 트레이더들이 기능을 검토하고 검증할 수 있도록 했습니다. 작성자에게 찬사를 보냅니다! 이 코드는 무료로 사용할 수 있지만, 코드를 재게시하는 경우 하우스 룰이 적용된다는 점을 기억하세요.
Coming Soon: ChrisMoodyTrading.com
면책사항
해당 정보와 게시물은 금융, 투자, 트레이딩 또는 기타 유형의 조언이나 권장 사항으로 간주되지 않으며, 트레이딩뷰에서 제공하거나 보증하는 것이 아닙니다. 자세한 내용은 이용 약관을 참조하세요.