INVITE-ONLY SCRIPT
TCT Candle Pro
TCT Candle Pro
Detail Explanation:
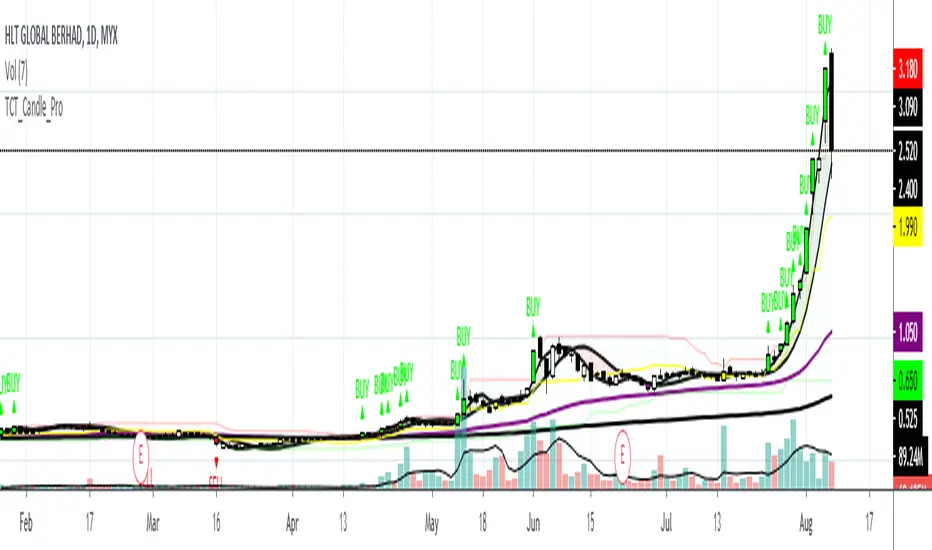
1. Red Candle
- Indicate that the market share is in a bearish trend and sell signal is triggered. It is when the price breaks certain support(referring to channel indicator) then the candle will turn to red.
2. Green Candle
- Indicate that the market share is in a bullish trend and buy signal is triggered but still needs another confirmation indicator. It is when the price breaks certain resistance(referring to the channel indicator) then the candle will turn to green.
3. Purple Line
- It is a moving average that indicates the lifeline of the market shares. Traders also can use the line as support.
4. Black Line
- It is a moving average that indicates the long term trend for the market shares.
5. Red Fill
- The fill will turn red when two moving average crossunder each other. It is customized to fill and the colors also can be changed to make the indicator more interesting to users.
6. Green Fill
- The fill will turn green when two moving average crossovers each other. It is customized to fill and the colors also can be changed to make the indicator more interesting to users.
How to use the indicators?
There are two lines that need to be focused on this indicator which is the Purple Line and Black Line.
When the Purple Line crossover Black Line, the momentum of the market share will start and usually the price will move upwards.
Users can try to use this indicator and wait for volume in when the Purple Line is nearing the Black Line or both lines crossover each other.
However, this indicator still needs other indicators for confirmation before clicking buy.
This indicators best to be used in timeframe 5minutes(tf5m), timeframe 30minutes(tf30m), and timeframe 1hour(tf60m).
Contact me if you want to try this indicator.
Detail Explanation:
1. Red Candle
- Indicate that the market share is in a bearish trend and sell signal is triggered. It is when the price breaks certain support(referring to channel indicator) then the candle will turn to red.
2. Green Candle
- Indicate that the market share is in a bullish trend and buy signal is triggered but still needs another confirmation indicator. It is when the price breaks certain resistance(referring to the channel indicator) then the candle will turn to green.
3. Purple Line
- It is a moving average that indicates the lifeline of the market shares. Traders also can use the line as support.
4. Black Line
- It is a moving average that indicates the long term trend for the market shares.
5. Red Fill
- The fill will turn red when two moving average crossunder each other. It is customized to fill and the colors also can be changed to make the indicator more interesting to users.
6. Green Fill
- The fill will turn green when two moving average crossovers each other. It is customized to fill and the colors also can be changed to make the indicator more interesting to users.
How to use the indicators?
There are two lines that need to be focused on this indicator which is the Purple Line and Black Line.
When the Purple Line crossover Black Line, the momentum of the market share will start and usually the price will move upwards.
Users can try to use this indicator and wait for volume in when the Purple Line is nearing the Black Line or both lines crossover each other.
However, this indicator still needs other indicators for confirmation before clicking buy.
This indicators best to be used in timeframe 5minutes(tf5m), timeframe 30minutes(tf30m), and timeframe 1hour(tf60m).
Contact me if you want to try this indicator.
초대 전용 스크립트
이 스크립트는 작성자가 승인한 사용자만 접근할 수 있습니다. 사용하려면 요청을 보내고 승인을 받아야 합니다. 일반적으로 결제 후에 승인이 이루어집니다. 자세한 내용은 아래 작성자의 지침을 따르거나 Trader_Cenonet에게 직접 문의하세요.
트레이딩뷰는 스크립트 작성자를 완전히 신뢰하고 스크립트 작동 방식을 이해하지 않는 한 스크립트 비용을 지불하거나 사용하지 않는 것을 권장하지 않습니다. 무료 오픈소스 대체 스크립트는 커뮤니티 스크립트에서 찾을 수 있습니다.
작성자 지시 사항
Contact me if you want to try other indicators like TAD Systems, MCDX, and many more. (t.me/afehakmal)
면책사항
이 정보와 게시물은 TradingView에서 제공하거나 보증하는 금융, 투자, 거래 또는 기타 유형의 조언이나 권고 사항을 의미하거나 구성하지 않습니다. 자세한 내용은 이용 약관을 참고하세요.