OPEN-SOURCE SCRIPT
업데이트됨 Daily Chart ATR & Movement %
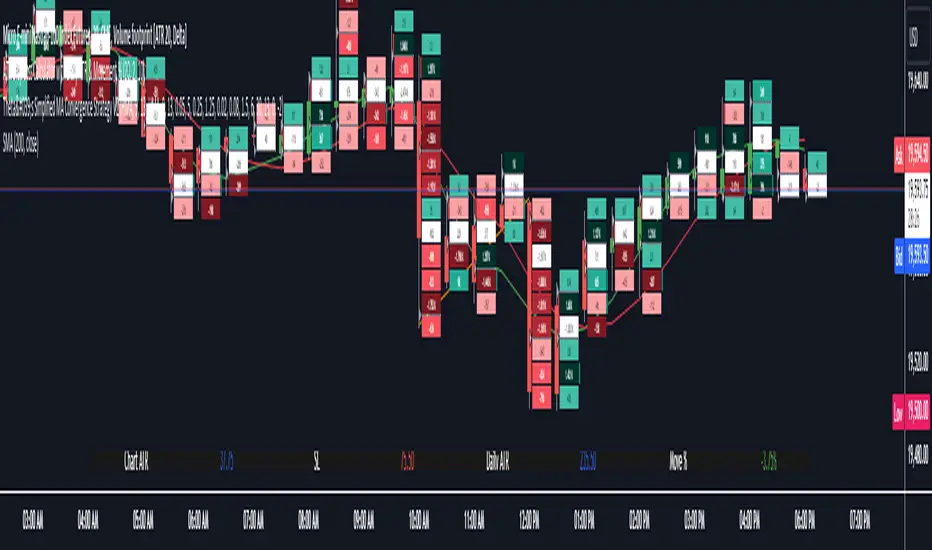
This Pine Script, titled "Daily ATR & Movement %," is designed for traders looking to gauge volatility and price movements relative to that volatility directly on their trading chart. The script calculates and displays the Average True Range (ATR) over a 14-day period using daily data, alongside the percentage movement of the current price from the previous day's close, scaled by the ATR. These metrics provide a snapshot of daily volatility and the magnitude of price movements within that context, which can be crucial for making informed trading decisions, especially in markets where volatility is a significant factor.
Key Features:
How to Use:
Setup: Apply the indicator to any chart.
Customization: Adjust the label size and vertical position to suit your viewing preference using the script’s input options.
Interpretation: Monitor the displayed ATR value and movement percentage to assess volatility and relative price movements. High percentages could indicate significant moves worth trading, while low percentages suggest minor changes.
This script is particularly useful for traders who rely on volatility-based trading strategies, such as breakout trading, where understanding the context of price movements relative to typical market fluctuations can provide a strategic edge.
Key Features:
- Daily ATR Calculation: Utilizes the ta.atr(14) function to compute the Average True Range on a daily basis, which measures market volatility by decomposing the entire range of asset prices for that day.
- Movement Percentage: The script calculates the movement from yesterday’s closing price to today’s current price as a percentage of the daily ATR. This shows how significant today's price change is relative to the typical daily volatility, which helps in understanding whether the price movement is substantial or trivial.
- Customizable Label Display: Traders can customize the display through a user input dropdown menu for label size ("small", "normal", "large", "huge") and a slider for vertical offset. This allows for better visibility and customization based on user preference and screen setup.
- Dynamic Label Updates: A label is dynamically updated each bar with the latest ATR value and movement percentage. This ongoing update keeps traders informed in real-time without manual recalculations.
How to Use:
Setup: Apply the indicator to any chart.
Customization: Adjust the label size and vertical position to suit your viewing preference using the script’s input options.
Interpretation: Monitor the displayed ATR value and movement percentage to assess volatility and relative price movements. High percentages could indicate significant moves worth trading, while low percentages suggest minor changes.
This script is particularly useful for traders who rely on volatility-based trading strategies, such as breakout trading, where understanding the context of price movements relative to typical market fluctuations can provide a strategic edge.
릴리즈 노트
Updates to width padding오픈 소스 스크립트
트레이딩뷰의 진정한 정신에 따라, 이 스크립트의 작성자는 이를 오픈소스로 공개하여 트레이더들이 기능을 검토하고 검증할 수 있도록 했습니다. 작성자에게 찬사를 보냅니다! 이 코드는 무료로 사용할 수 있지만, 코드를 재게시하는 경우 하우스 룰이 적용된다는 점을 기억하세요.
면책사항
해당 정보와 게시물은 금융, 투자, 트레이딩 또는 기타 유형의 조언이나 권장 사항으로 간주되지 않으며, 트레이딩뷰에서 제공하거나 보증하는 것이 아닙니다. 자세한 내용은 이용 약관을 참조하세요.
오픈 소스 스크립트
트레이딩뷰의 진정한 정신에 따라, 이 스크립트의 작성자는 이를 오픈소스로 공개하여 트레이더들이 기능을 검토하고 검증할 수 있도록 했습니다. 작성자에게 찬사를 보냅니다! 이 코드는 무료로 사용할 수 있지만, 코드를 재게시하는 경우 하우스 룰이 적용된다는 점을 기억하세요.
면책사항
해당 정보와 게시물은 금융, 투자, 트레이딩 또는 기타 유형의 조언이나 권장 사항으로 간주되지 않으며, 트레이딩뷰에서 제공하거나 보증하는 것이 아닙니다. 자세한 내용은 이용 약관을 참조하세요.