OPEN-SOURCE SCRIPT
RSI Colored by Relative Strength

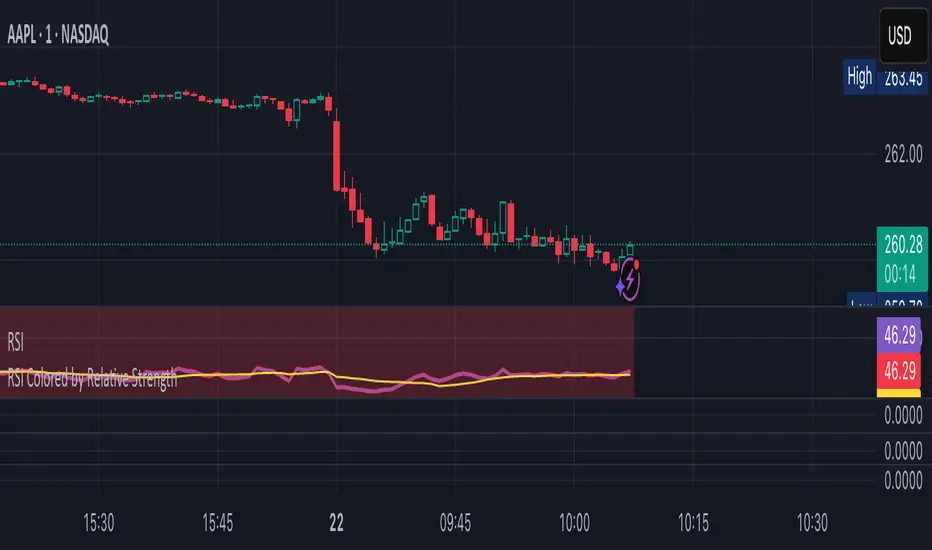
This indicator enhances the traditional RSI by combining it with Relative Strength (RS) — the ratio of an asset’s price to a chosen benchmark (e.g., SPY, QQQ, BTCUSD) — to create a more accurate, powerful, and dynamic momentum confirmation tool.
Instead of relying solely on RSI’s internal momentum, this version color-codes RSI values and backgrounds based on whether the asset is outperforming, underperforming, or neutral relative to the benchmark, not only identifying the RSI value, but color codes it in relation to the overall market to give more accurate confirmations.
• RS > 1 → The asset is outperforming the benchmark (relative strength).
• RS < 1 → The asset is underperforming.
• RS ≈ 1 → Neutral or moving in sync with the benchmark.
Gradient background zones:
• Green tones = outperformance (RS > 1).
• Red tones = underperformance (RS < 1).
• Gray neutral band = parity (RS ≈ 1).
Intensity adjusts dynamically based on how far RS deviates from 1, giving an at-a-glance view of market leadership strength.
• Color-coded RSI line: Green when RS > 1, red when RS < 1.
• Optional markers and labels show confirmed RS+RSI crossovers with smart spacing to prevent clutter.
• Alerts included for bullish and bearish RS+RSI alignment events.
How to Use
1. Add your preferred benchmark symbol (default: SPY).
2. Move this indicator into the same pane as your RSI (No need to overlay, does so automatically) and can also be used standalone.
3. Watch for:
• Green RSI & background: Significant momentum strength (asset trending upward and outpacing the market).
• Red RSI & background: False or insignificant momentum (asset lagging).
• Gray zone: neutral phase — consolidation or rotation period.
Use this as a trend-confirmation filter rather than a signal generator.
For example:
• Confirm and refine breakout entries when RS > 1 (RSI support = stronger conviction).
• Take profits when RSI weakens and RS slips below 1.
오픈 소스 스크립트
트레이딩뷰의 진정한 정신에 따라, 이 스크립트의 작성자는 이를 오픈소스로 공개하여 트레이더들이 기능을 검토하고 검증할 수 있도록 했습니다. 작성자에게 찬사를 보냅니다! 이 코드는 무료로 사용할 수 있지만, 코드를 재게시하는 경우 하우스 룰이 적용된다는 점을 기억하세요.
// © TylerisTrading
면책사항
해당 정보와 게시물은 금융, 투자, 트레이딩 또는 기타 유형의 조언이나 권장 사항으로 간주되지 않으며, 트레이딩뷰에서 제공하거나 보증하는 것이 아닙니다. 자세한 내용은 이용 약관을 참조하세요.
오픈 소스 스크립트
트레이딩뷰의 진정한 정신에 따라, 이 스크립트의 작성자는 이를 오픈소스로 공개하여 트레이더들이 기능을 검토하고 검증할 수 있도록 했습니다. 작성자에게 찬사를 보냅니다! 이 코드는 무료로 사용할 수 있지만, 코드를 재게시하는 경우 하우스 룰이 적용된다는 점을 기억하세요.
// © TylerisTrading
면책사항
해당 정보와 게시물은 금융, 투자, 트레이딩 또는 기타 유형의 조언이나 권장 사항으로 간주되지 않으며, 트레이딩뷰에서 제공하거나 보증하는 것이 아닙니다. 자세한 내용은 이용 약관을 참조하세요.