PROTECTED SOURCE SCRIPT
Square of natural number_RAMLAKSHMANDAS
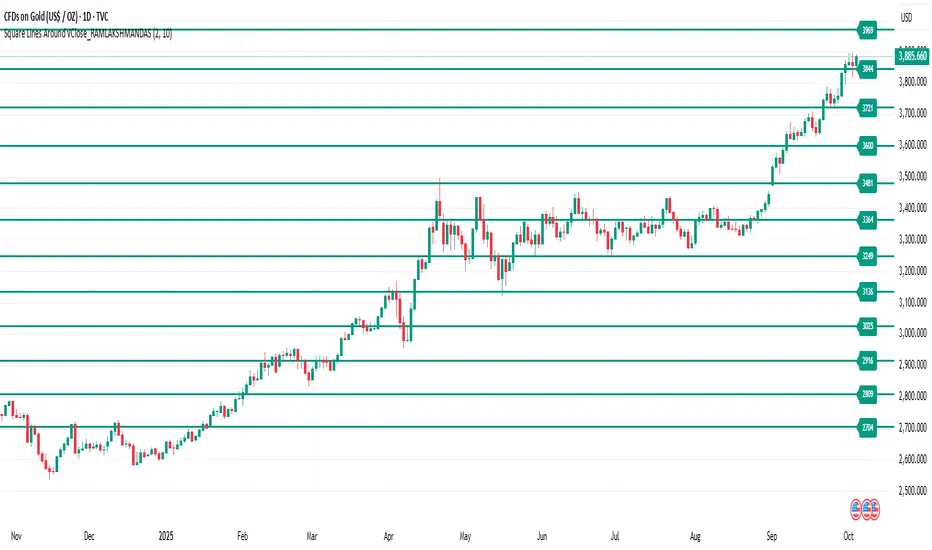
This indicator draws horizontal lines at square-number price levels around the square root of the current closing price. Inspired by Gann’s geometric approach, these lines serve as potential support and resistance levels. Each line is labeled with its price for easy identification. Traders can use it to visualize mathematically significant zones, identify reversal points, and enhance numerical trading strategies.
Pine Script Indicator: Odd Square Levels
This Pine Script indicator, designed for TradingView v6, plots dynamic horizontal support and resistance levels on the chart based on the square root of the current close price. It adheres to the specific principles of Gann theory, focusing exclusively on odd square numbers.
How it Works:
The indicator first calculates a base number by taking the square root of the current bar's close price and rounding it. This base number acts as the center of a user-defined range. The script then iterates through all the natural numbers within this range.
For each number in the range, it performs a check:
If the number is odd, the script calculates its square and plots a horizontal line at that price level.
If the number is even, the script adds 1 to the number before squaring it and plotting the line. This ensures that only levels corresponding to odd squares are ever drawn.
Key Features:
Dynamic Levels: The levels automatically adjust as the market price changes, providing real-time support and resistance zones.
Customizable Range: The user can specify an offset (e.g., ±10) around the square root of the price to control the number of levels displayed.
Visual Customization: Users can modify the color and width of the lines to suit their preference.
On-Chart Labels: The indicator can be configured to display a label next to each line, showing the number squared and the resulting price level (e.g., 3² = 9).
Performance Optimization: The indicator is designed to run efficiently by deleting old drawings on each new bar, preventing chart clutter and ensuring a smooth experience.
Ideal Usage:
This indicator is a powerful tool for traders who follow Gann theory or are looking for unconventional support and resistance levels. The levels are particularly useful for identifying potential trend reversals or areas of strong confluence with other trading strategies. It is recommended to use the indicator on volatile asset classes where price movements are significant, such as cryptocurrencies, as these assets tend to follow these types of mathematical relationships.
보호된 스크립트입니다
이 스크립트는 비공개 소스로 게시됩니다. 하지만 이를 자유롭게 제한 없이 사용할 수 있습니다 – 자세한 내용은 여기에서 확인하세요.
면책사항
해당 정보와 게시물은 금융, 투자, 트레이딩 또는 기타 유형의 조언이나 권장 사항으로 간주되지 않으며, 트레이딩뷰에서 제공하거나 보증하는 것이 아닙니다. 자세한 내용은 이용 약관을 참조하세요.
보호된 스크립트입니다
이 스크립트는 비공개 소스로 게시됩니다. 하지만 이를 자유롭게 제한 없이 사용할 수 있습니다 – 자세한 내용은 여기에서 확인하세요.
면책사항
해당 정보와 게시물은 금융, 투자, 트레이딩 또는 기타 유형의 조언이나 권장 사항으로 간주되지 않으며, 트레이딩뷰에서 제공하거나 보증하는 것이 아닙니다. 자세한 내용은 이용 약관을 참조하세요.