OPEN-SOURCE SCRIPT
업데이트됨 Compare TOTAL, TOTAL2, TOTAL3, and OTHERS
Compare TOTAL, TOTAL2, TOTAL3, and OTHERS
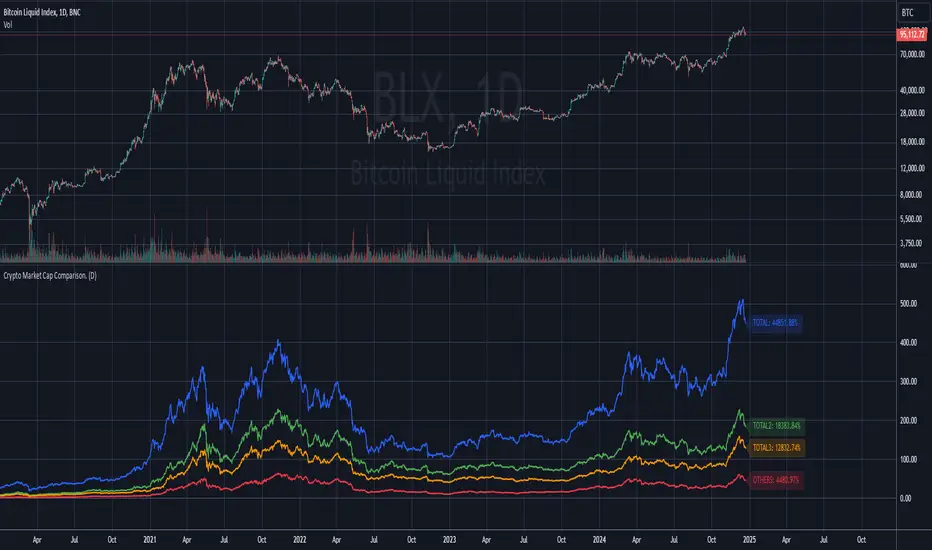
This indicator compares the performance of major cryptocurrency market cap indices: TOTAL, TOTAL2, TOTAL3, and OTHERS. It normalizes each index's performance relative to its starting value and visualizes their relative changes over time.
Features
- Normalized Performance: Tracks the percentage change of each index from its initial value.
- Customizable Timeframe: Allows users to select a base timeframe for the data (e.g., daily, weekly).
- Dynamic Labels: Displays the latest performance of each index as a label on the chart, aligned to the right of the corresponding line for easy comparison.
- Color-Coded Lines: Each index is assigned a distinct color for clear differentiation:
-- TOTAL (Blue): Represents the total cryptocurrency market cap.
-- TOTAL2 (Green): Excludes Bitcoin.
-- TOTAL3 (Orange): Excludes Bitcoin and Ethereum.
-- OTHERS (Red): Represents all cryptocurrencies excluding the top 10 by market cap.
- Baseline Reference: Includes a horizontal line at 0% for reference.
Use Cases:
- Market Trends: Identify which segments of the cryptocurrency market are outperforming or underperforming over time.
- Portfolio Insights: Assess the impact of Bitcoin and Ethereum dominance on the broader market.
- Market Analysis: Compare smaller-cap coins (OTHERS) with broader indices (TOTAL, TOTAL2, and TOTAL3).
This script is ideal for traders and analysts who want a quick, visual way to track how different segments of the cryptocurrency market perform relative to each other over time.
Note: The performance is normalized to highlight percentage changes, not absolute values.
릴리즈 노트
screenshot updated오픈 소스 스크립트
트레이딩뷰의 진정한 정신에 따라, 이 스크립트의 작성자는 이를 오픈소스로 공개하여 트레이더들이 기능을 검토하고 검증할 수 있도록 했습니다. 작성자에게 찬사를 보냅니다! 이 코드는 무료로 사용할 수 있지만, 코드를 재게시하는 경우 하우스 룰이 적용된다는 점을 기억하세요.
면책사항
해당 정보와 게시물은 금융, 투자, 트레이딩 또는 기타 유형의 조언이나 권장 사항으로 간주되지 않으며, 트레이딩뷰에서 제공하거나 보증하는 것이 아닙니다. 자세한 내용은 이용 약관을 참조하세요.
오픈 소스 스크립트
트레이딩뷰의 진정한 정신에 따라, 이 스크립트의 작성자는 이를 오픈소스로 공개하여 트레이더들이 기능을 검토하고 검증할 수 있도록 했습니다. 작성자에게 찬사를 보냅니다! 이 코드는 무료로 사용할 수 있지만, 코드를 재게시하는 경우 하우스 룰이 적용된다는 점을 기억하세요.
면책사항
해당 정보와 게시물은 금융, 투자, 트레이딩 또는 기타 유형의 조언이나 권장 사항으로 간주되지 않으며, 트레이딩뷰에서 제공하거나 보증하는 것이 아닙니다. 자세한 내용은 이용 약관을 참조하세요.