PROTECTED SOURCE SCRIPT
업데이트됨 Sessions and Market Structure Highs and Lows
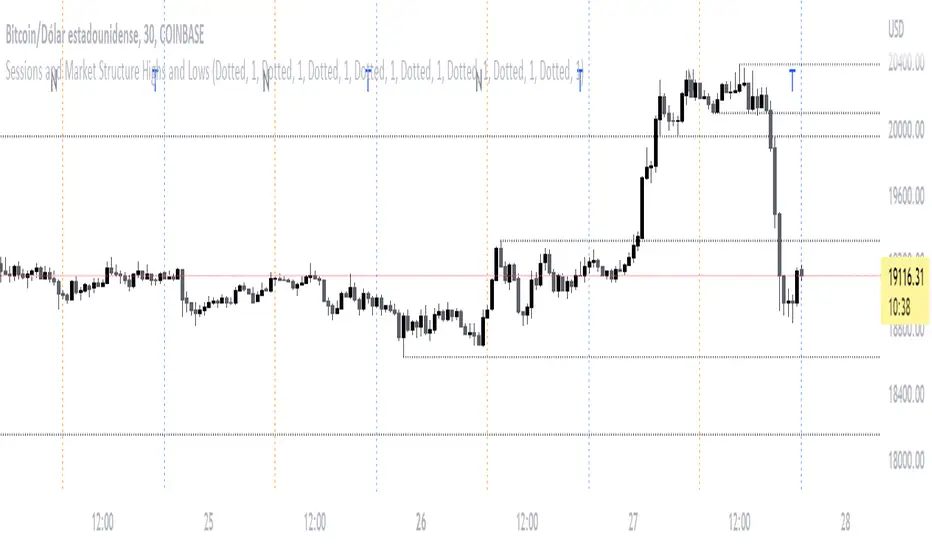
This Indicator has the purpose that traders can see the opening of the different sessions on the chart in a clean and visually pleasing way.
By adding the script to your chart, vertical lines will automatically appear at the specific opening hours of each session
What schedules are used by the Script?
Keep in mind that the style of the line can be modified from the indicator settings, by the way in case you do not want to see the main letter of each session on the chart, you can also deactivate it from the settings
Also, in a very entertaining way, you will be able to see the Highs and Lows of the corresponding temporalities.
By adding the script to your chart, vertical lines will automatically appear at the specific opening hours of each session
What schedules are used by the Script?
- The New York session starts at 07:30 GMT and its line will be represented by the color Orange
- Then for the London session the start is plotted at 03:30 GMT with the Gray line
- And finally the Asia/Tokyo session at 19:00 GMT with its Blue color line
Keep in mind that the style of the line can be modified from the indicator settings, by the way in case you do not want to see the main letter of each session on the chart, you can also deactivate it from the settings
Also, in a very entertaining way, you will be able to see the Highs and Lows of the corresponding temporalities.
릴리즈 노트
You can define open sessions time보호된 스크립트입니다
이 스크립트는 비공개 소스로 게시됩니다. 하지만 이를 자유롭게 제한 없이 사용할 수 있습니다 – 자세한 내용은 여기에서 확인하세요.
면책사항
해당 정보와 게시물은 금융, 투자, 트레이딩 또는 기타 유형의 조언이나 권장 사항으로 간주되지 않으며, 트레이딩뷰에서 제공하거나 보증하는 것이 아닙니다. 자세한 내용은 이용 약관을 참조하세요.
보호된 스크립트입니다
이 스크립트는 비공개 소스로 게시됩니다. 하지만 이를 자유롭게 제한 없이 사용할 수 있습니다 – 자세한 내용은 여기에서 확인하세요.
면책사항
해당 정보와 게시물은 금융, 투자, 트레이딩 또는 기타 유형의 조언이나 권장 사항으로 간주되지 않으며, 트레이딩뷰에서 제공하거나 보증하는 것이 아닙니다. 자세한 내용은 이용 약관을 참조하세요.